About the sketch pad
- It facilitates a visual and concrete, analytic and numeric, approach to topics in a Statistics I course.
- It DOES NOT REALLY TAKE A DERIVATIVE. It uses [ f(x +.005) - f(x - .005)]/.01 as an approximation of the derivative.
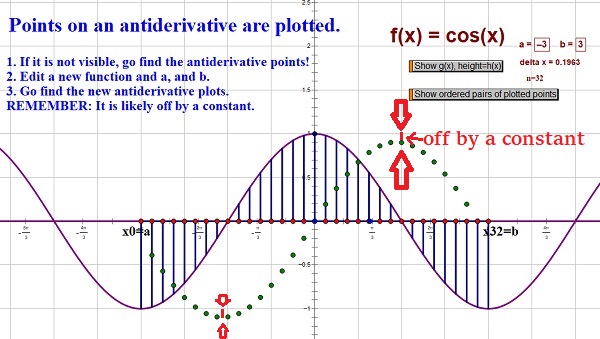
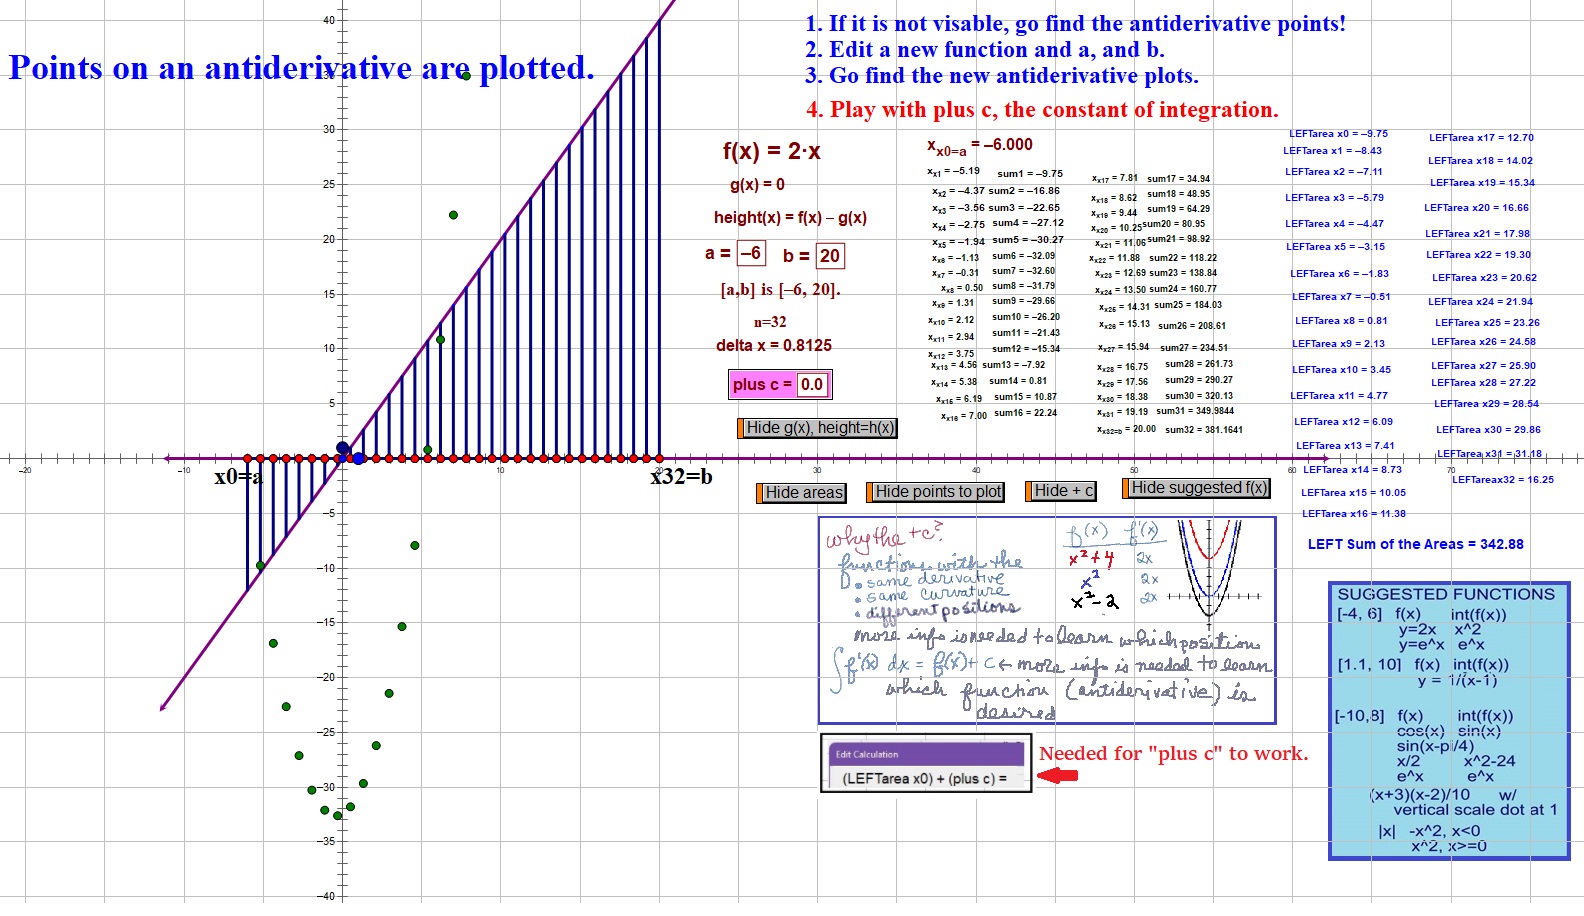
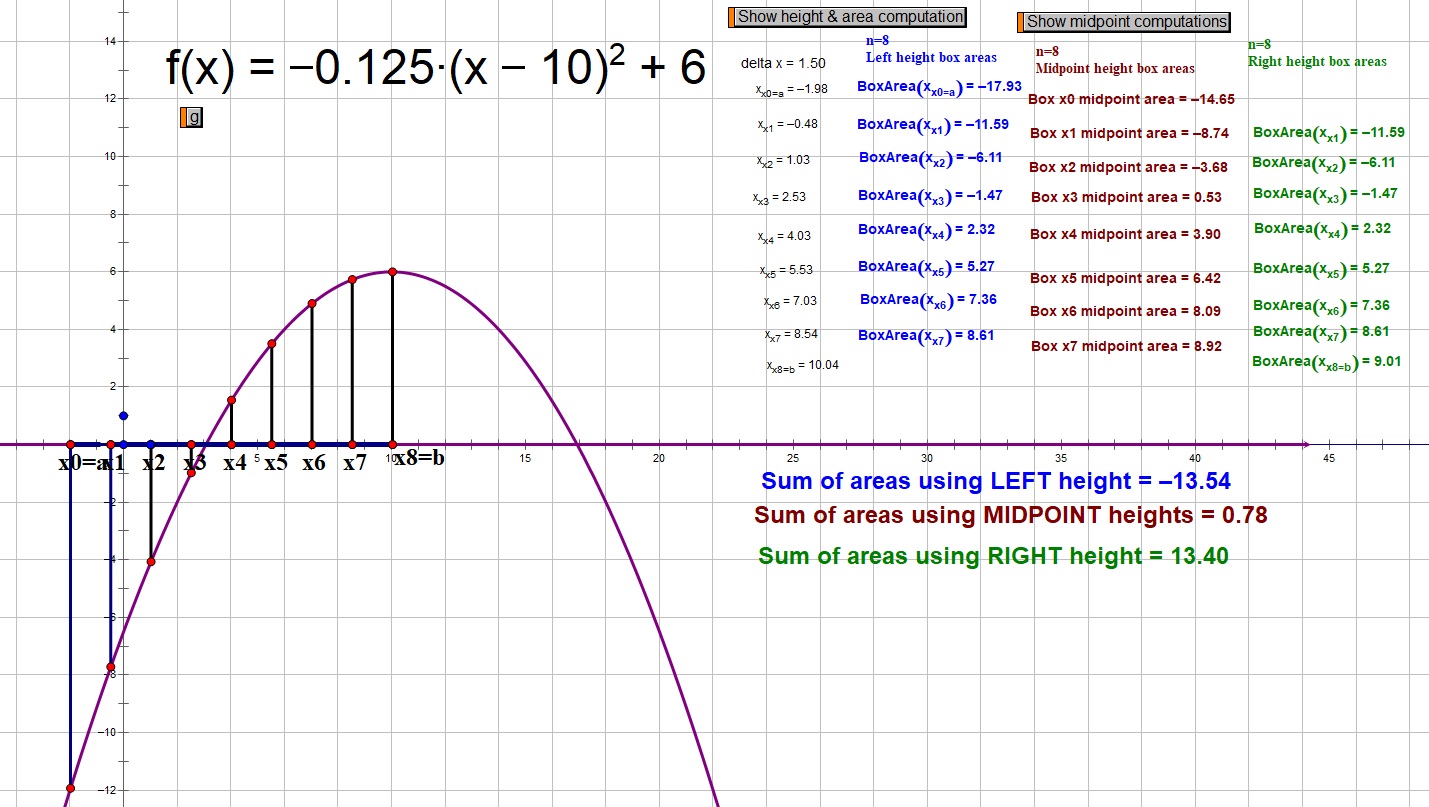
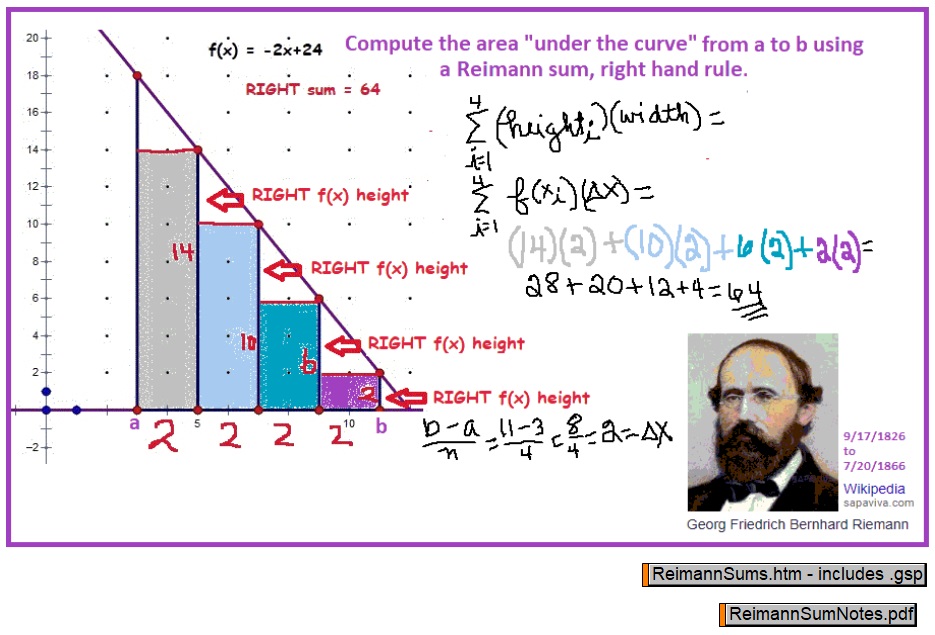
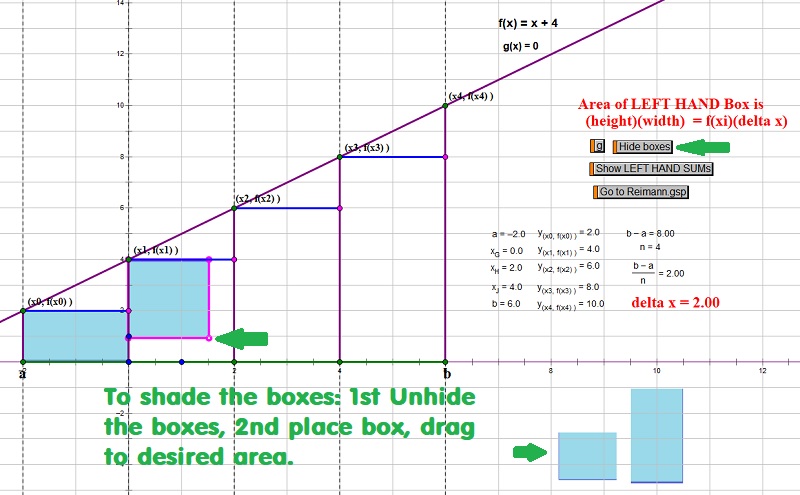
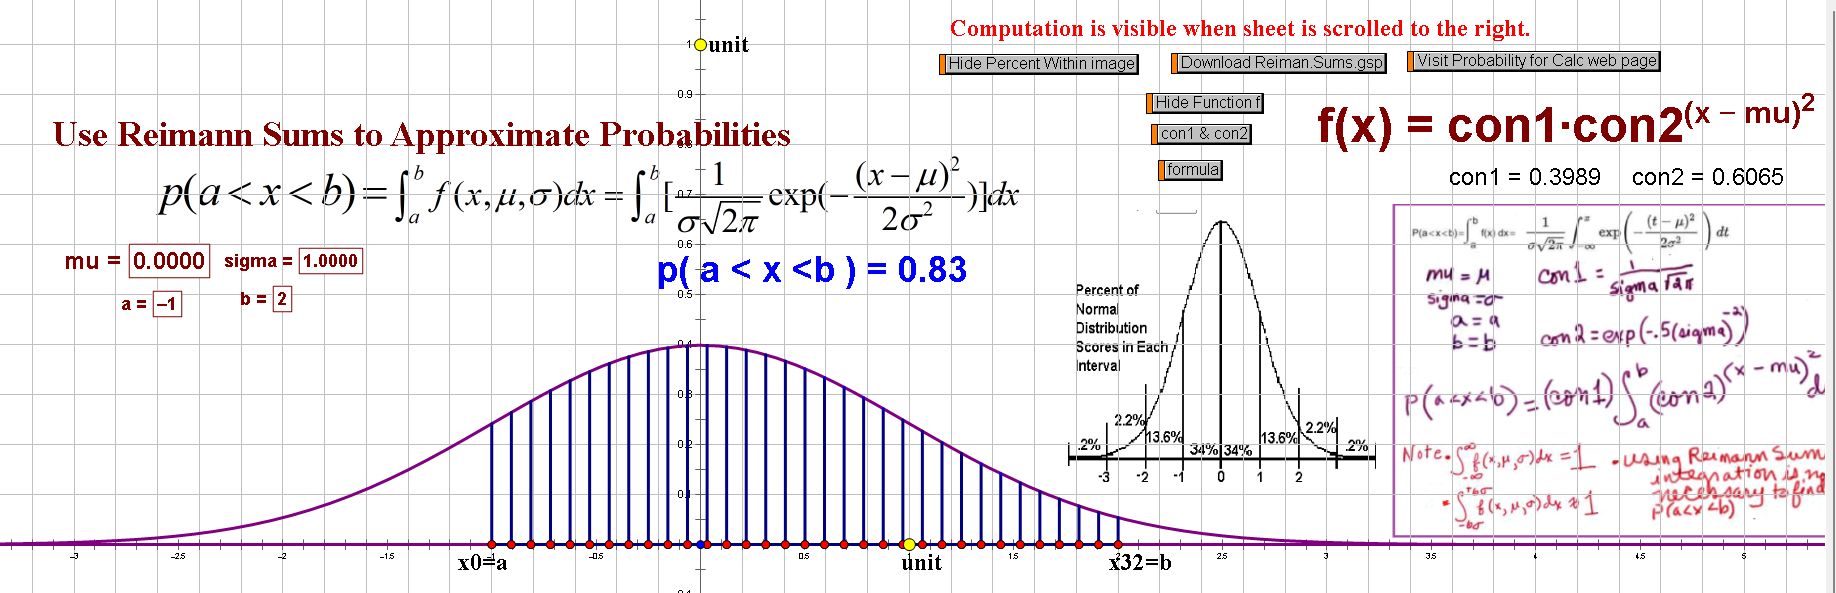
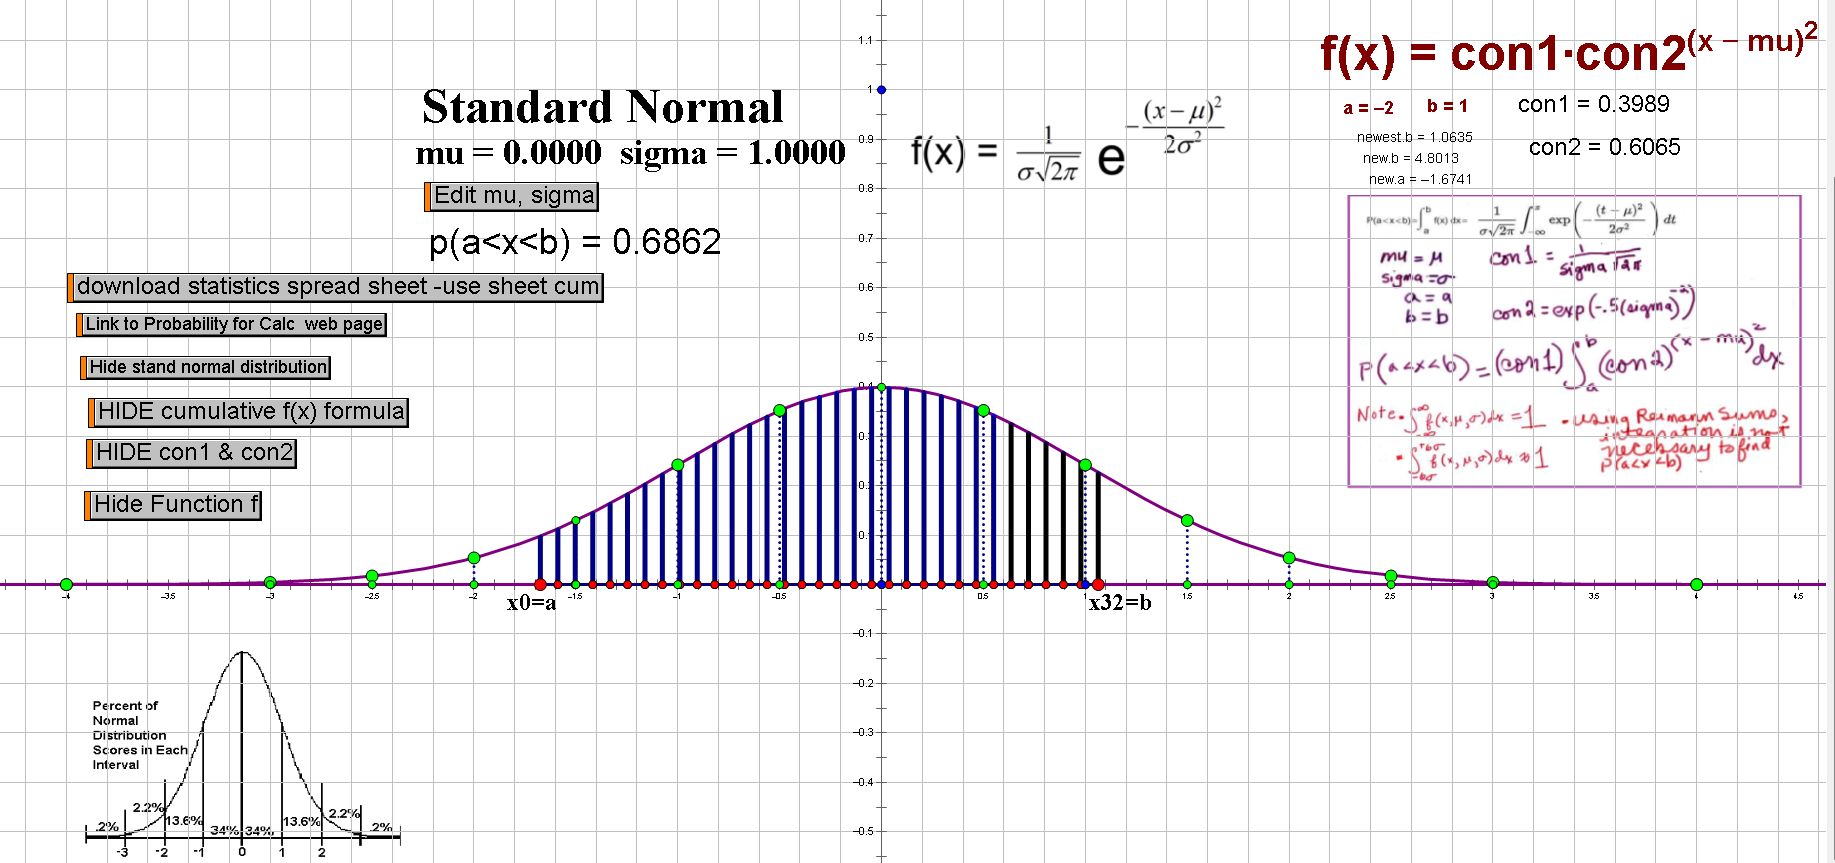
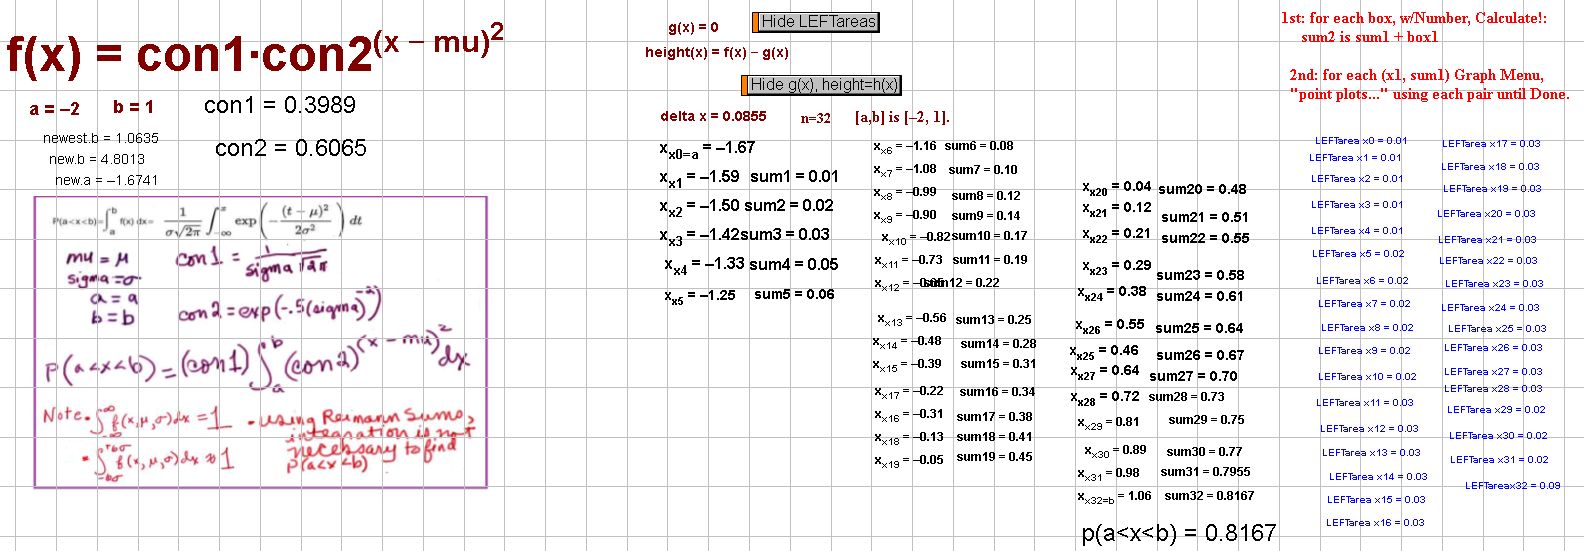
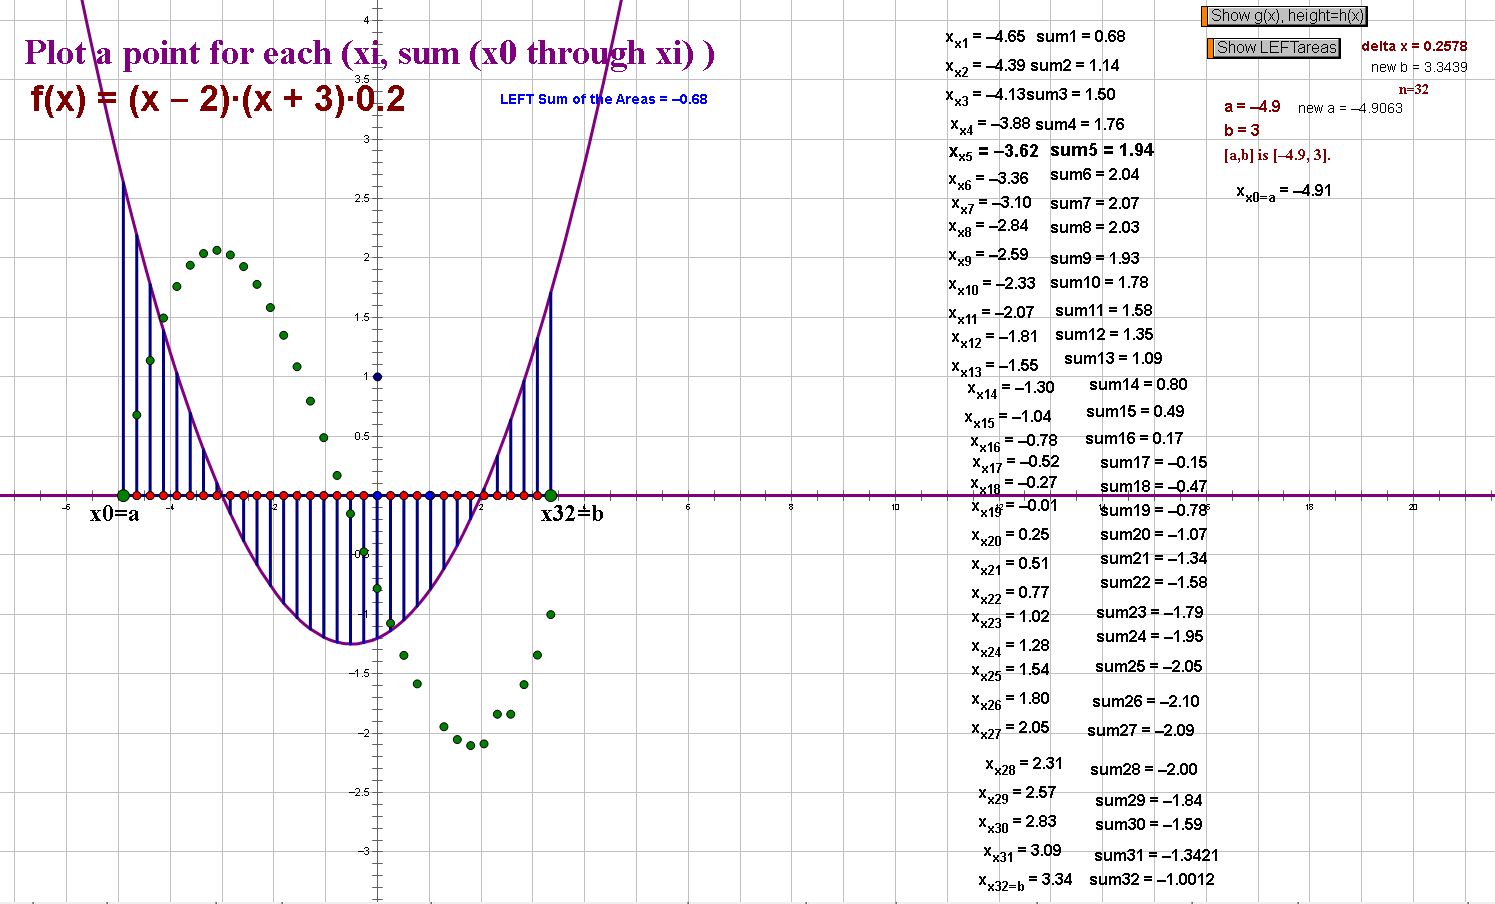
- It DOES NOT INTEGRATE. It uses sums of 32 Reimann boxes plotted to produce a plot of a cummulative curve.
- It DOES NOT present an algebraic approach or deal with computation problems and solutions.
- It focuses on the topics of
uniform,
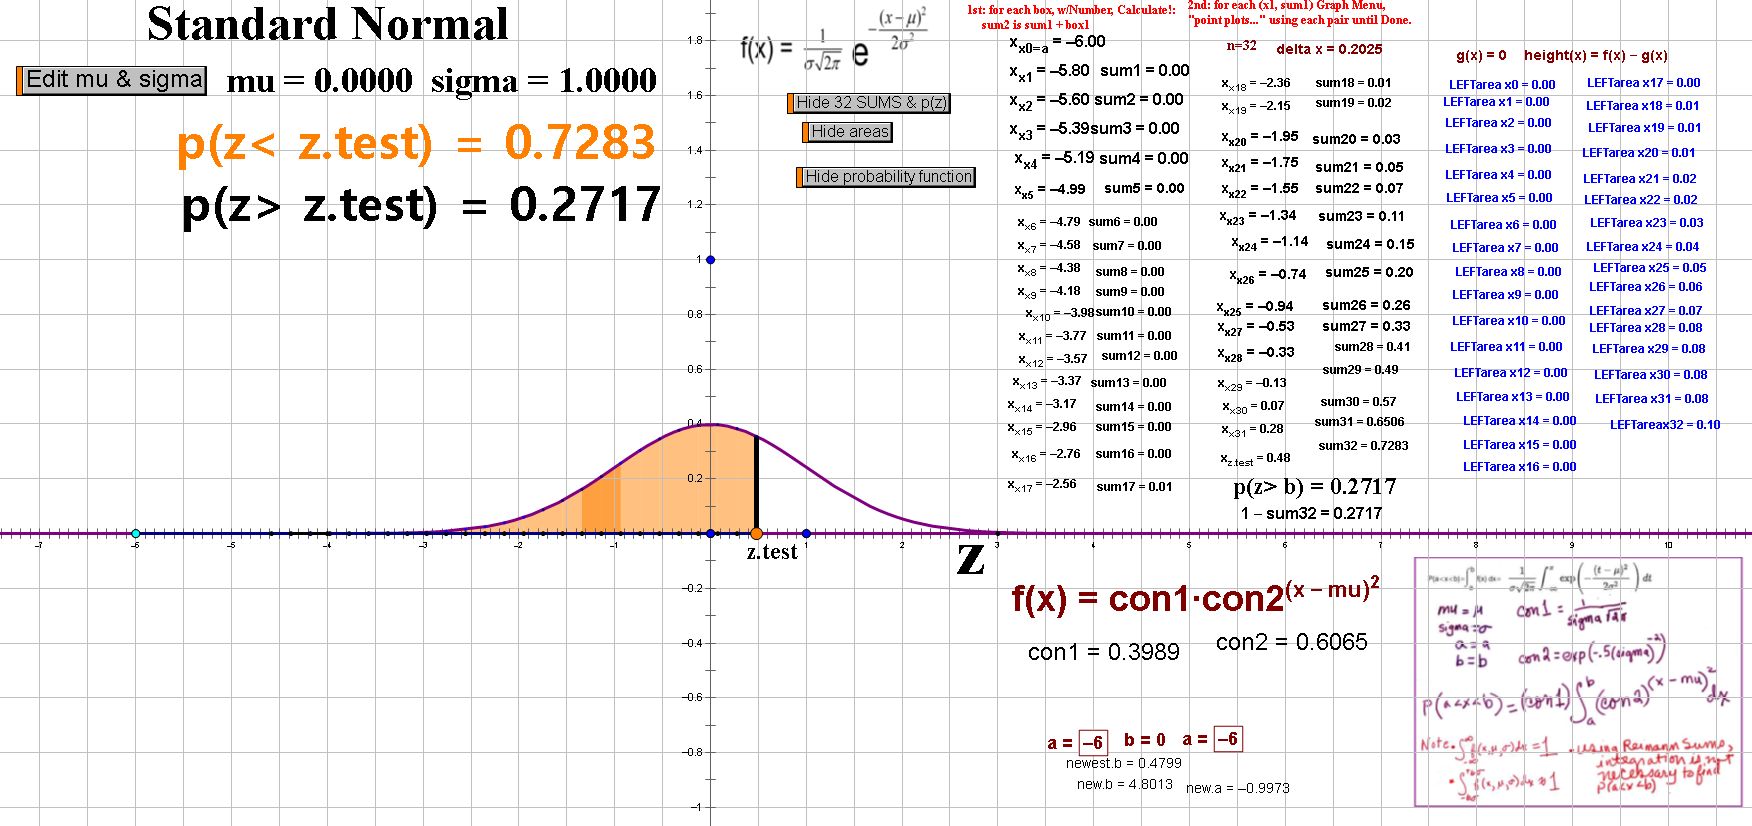
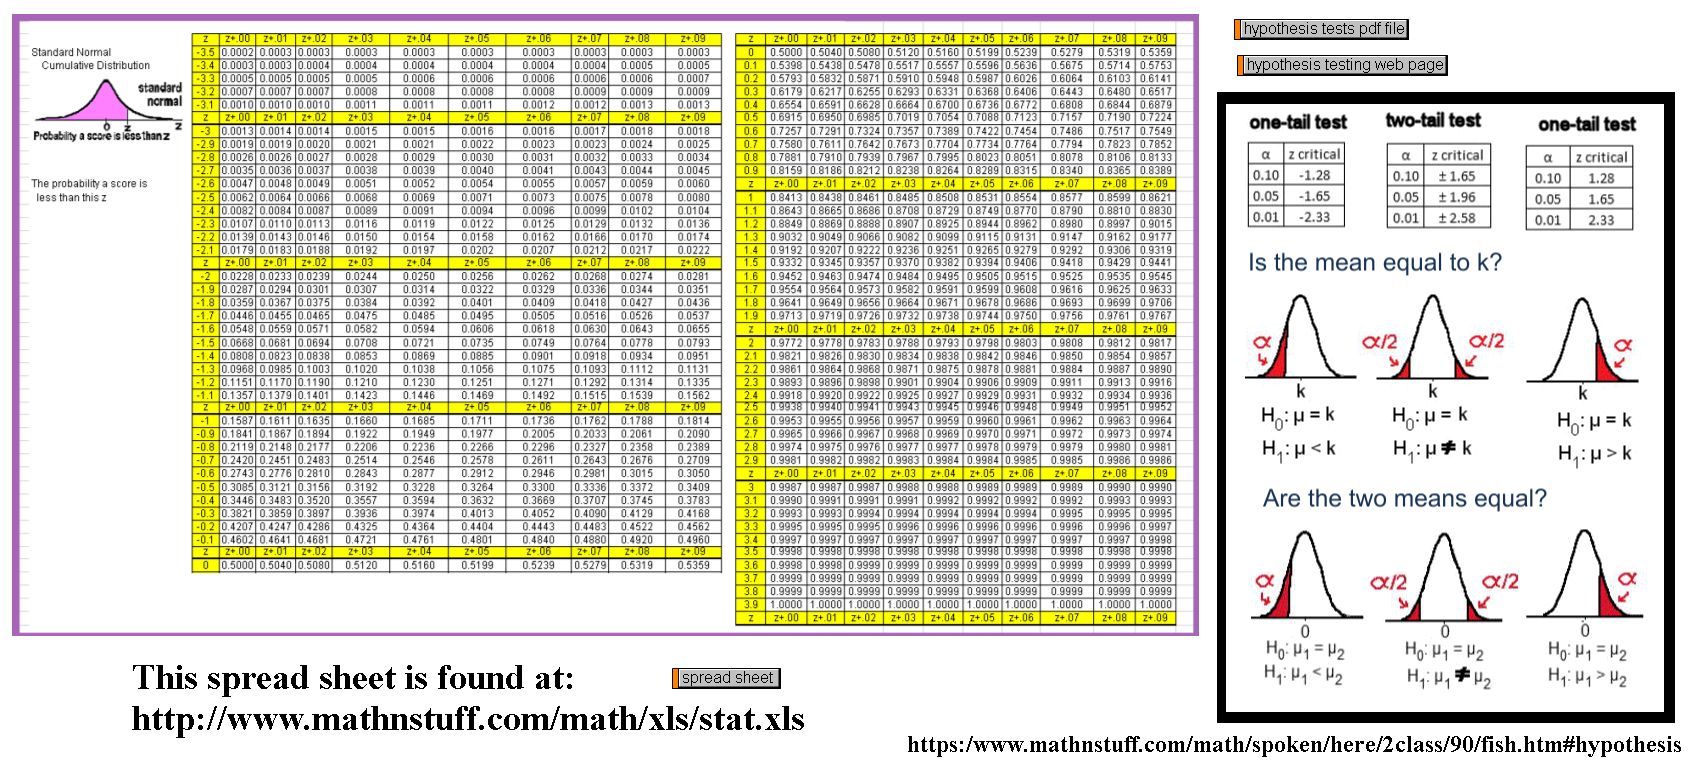
standard normal, and
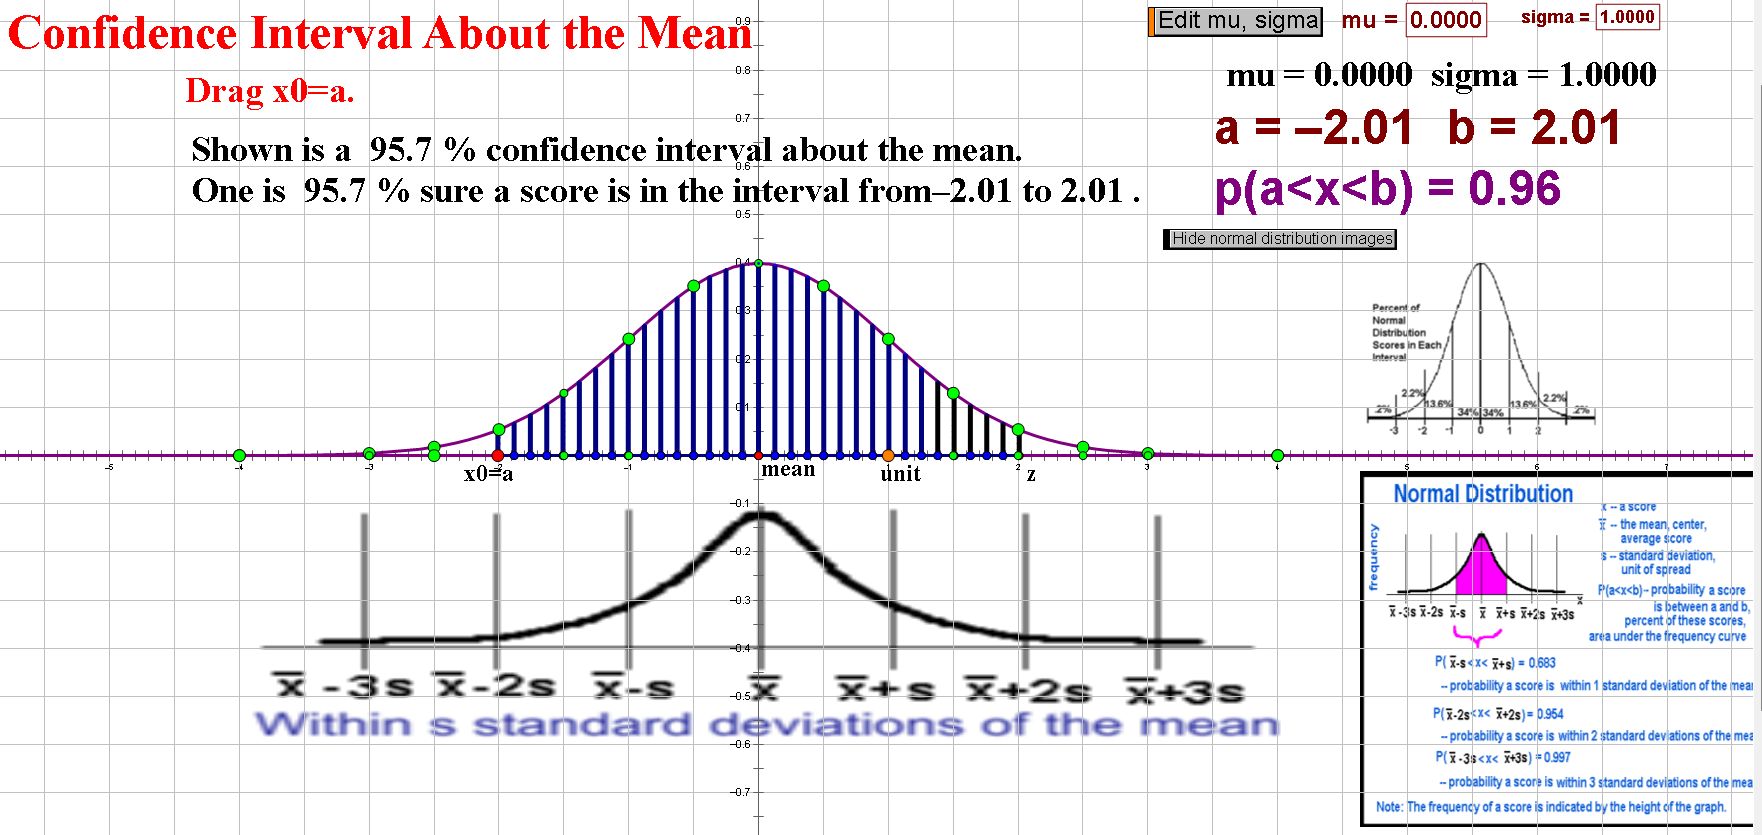
normal distributions,
stanines,
between and within a interval,
p(x < x.test),
p(z< z.test),
p(a < z < b),
confidence intervals,
alpha, p,
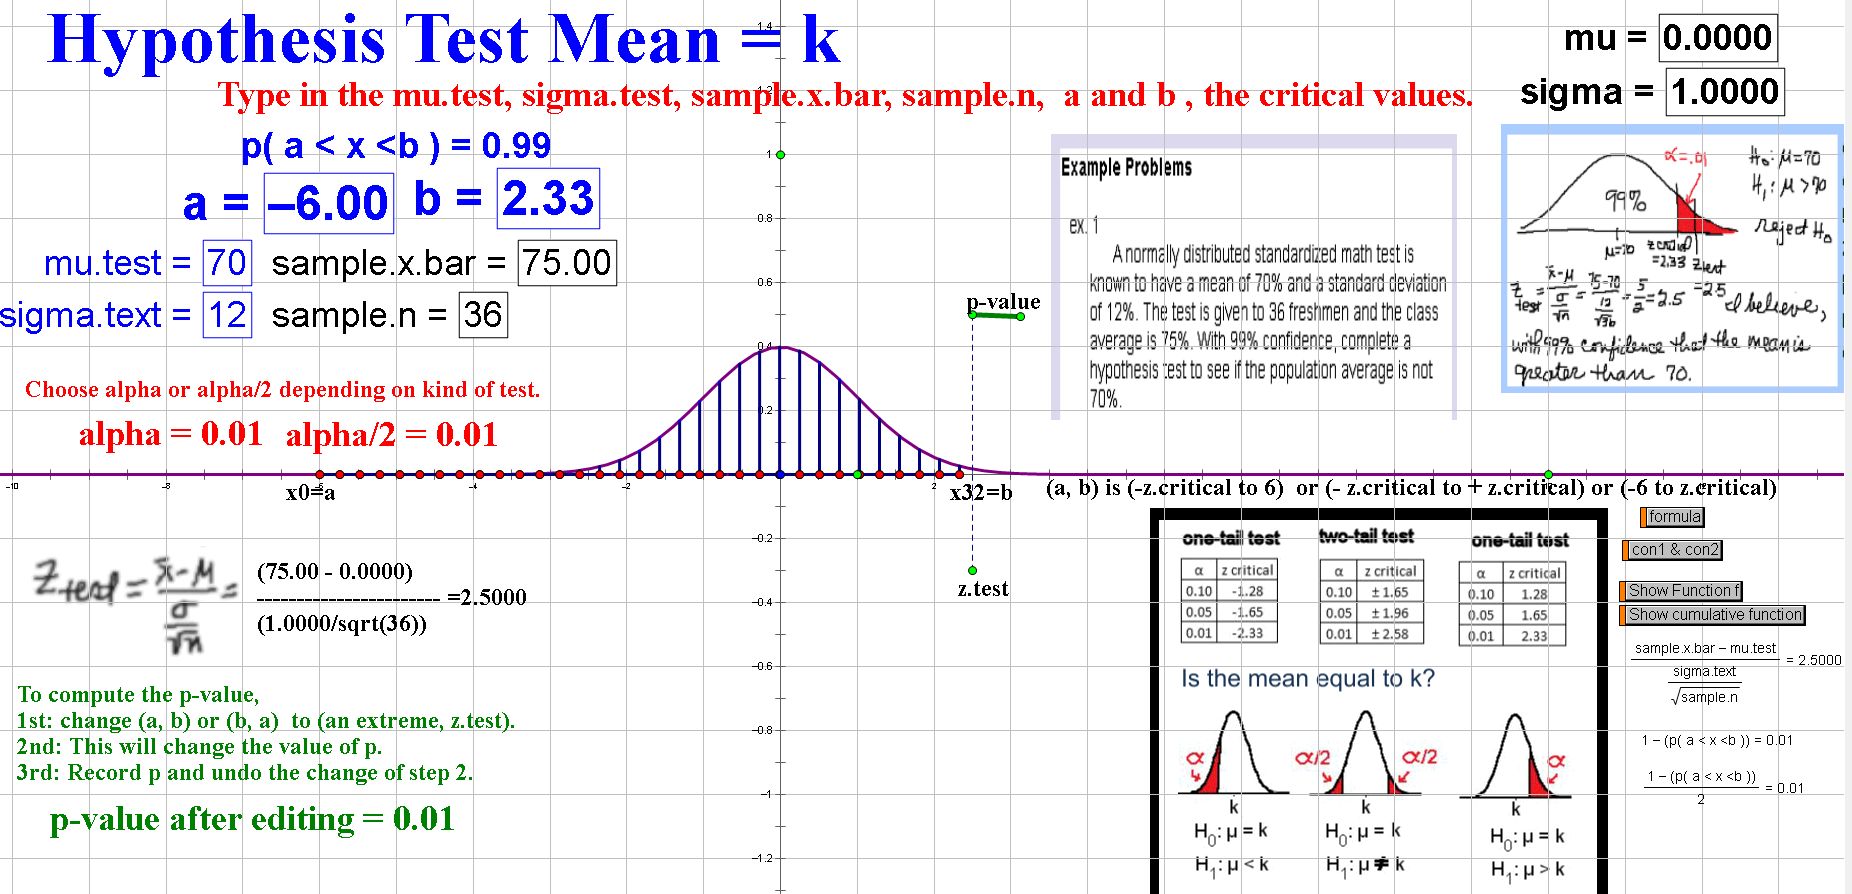
hypothesis testing images.
- It provides the calc I content to explain how the spreadsheet was constructed and
the use of the term "cumulative function," as in cumulative probability,
to facilitate use of the "Mother Tongue" rather than just "mathematics." See
The Languages of the Math Classroom
All material on this site is free. (Please cite the source.)
The sketchpads/resources from which this material is taken include
Reimann.htm,
limit.gsp,
DerAnyFx.gsp, and
ReimannSums.gsp.
Other Calc I material is found at:
 and and
 , and , and
 . .
Other Stat I material is found at:
 and and
 and and
 and and
 . .
|


 stat.gsp - The Statistics Sketchpad Teacher's Manual
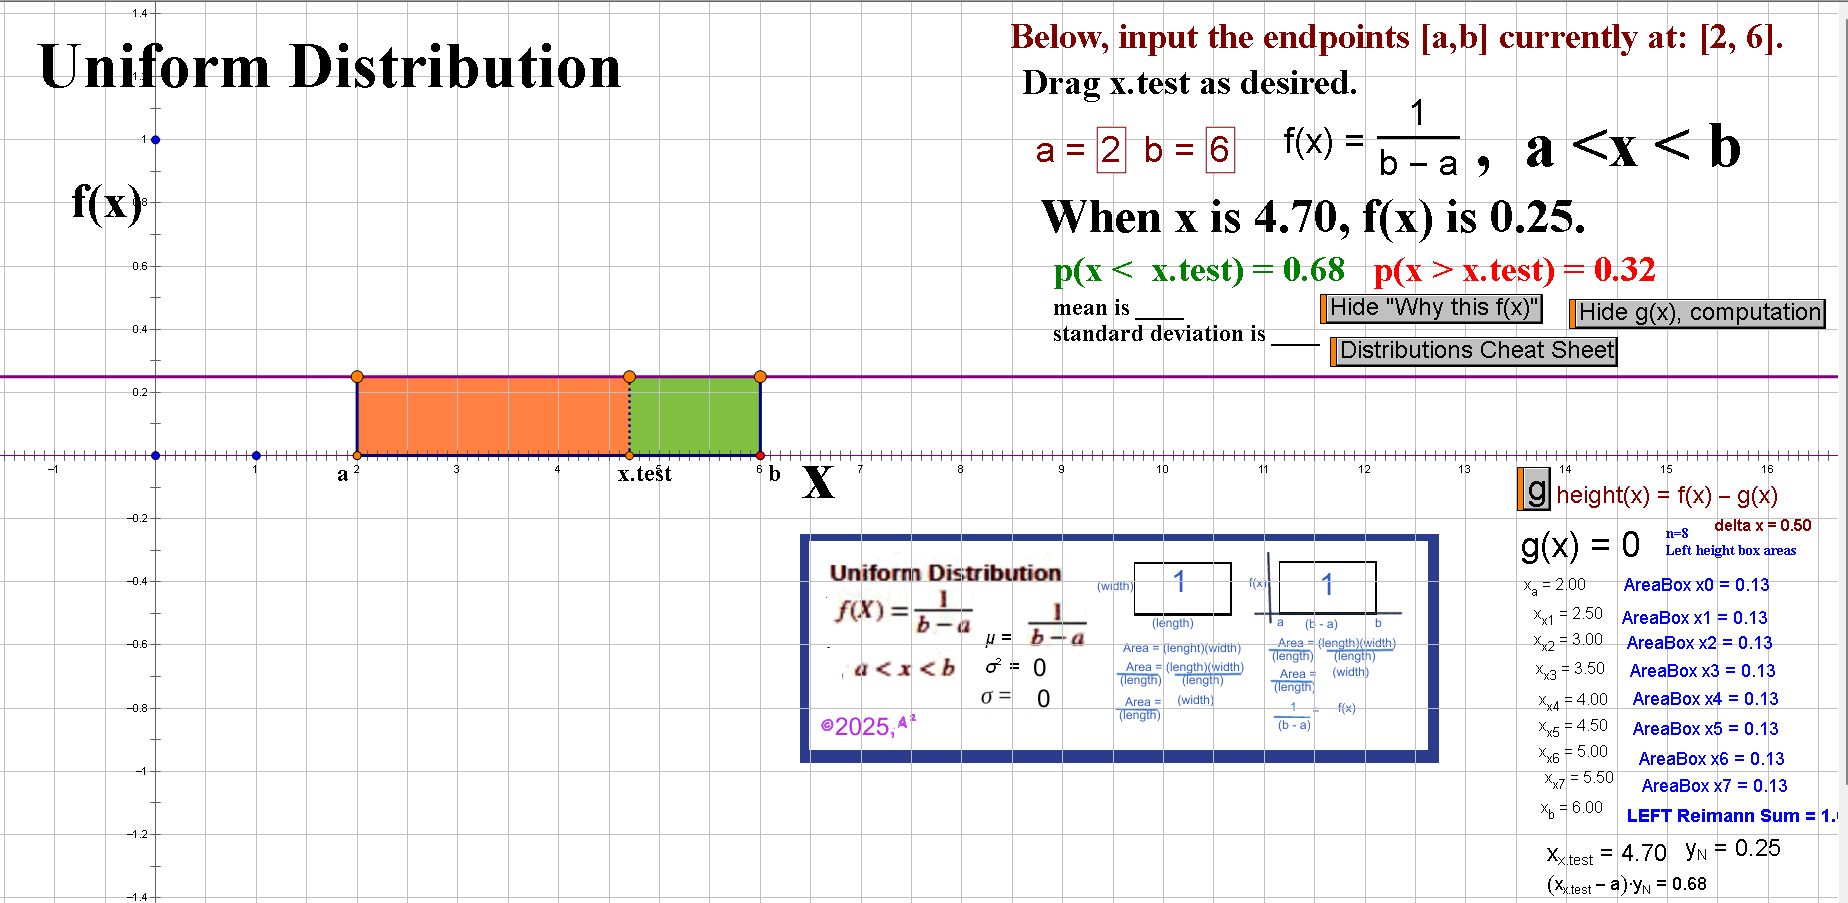


![[MC,i. Home]](http://www.mathnstuff.com/math/spoken/here/1gif/mcihome.gif)

![[Words]](http://www.mathnstuff.com/math/spoken/here/1gif/words.gif)