| Review If Needed |
- 0 - toc
- Links
-
Functions, graphing, fancy, history (see 0 - toc)
-
Derivatives Web Page
-
Reimann Sums gsp
-
ReimannSumNotes.pdf
-
Intro to Antiderivatives
-
Derivative Calculator at https://www.derivative-calculator.net/
-
Integral Calculator at https://www.integral-calculator.com/
- Activities
- * Use the above pages & calculators to assist in writing a test.
|
 |
|
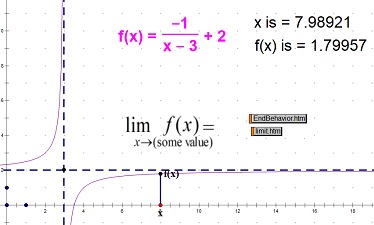
- 1 - LIMIT by approach
- Links
-
endbahavior.htm
-
limit.htm
-
limit.gsp
-
- Activities
- * Take a limit, as x approaches c, where f(c) is continuous
- * Take a limit, as x approaches c, where f(c) is not continuous,
- as in x=c is a vertical asymptote
- * Take a limit, as x approaches infinity
- * Change the function & repeat the above
- * Examine endbehavior
|
 |
|
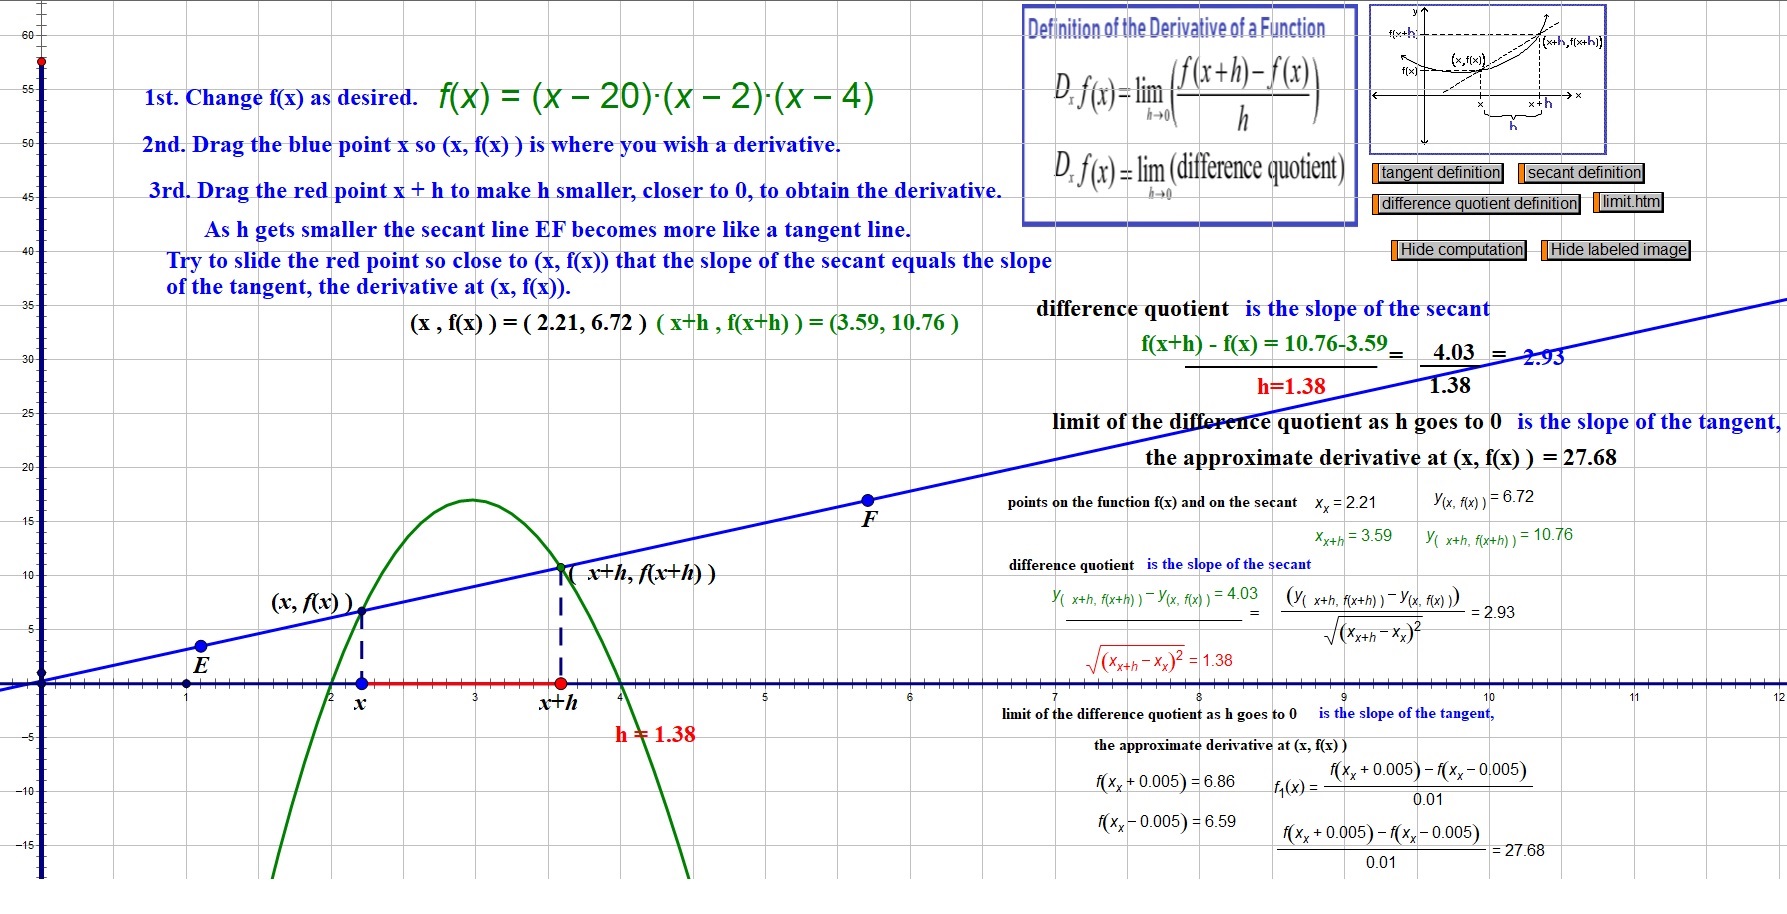
- 2 - DERIVATIVE by definition, secant
- Links
-
limit.htm
- Show work
-
limit.gsp
-
- Activities
- FOR THIS PAGE DO NOT CHANGE FUNCTION G(X).
- 1st. Drag the red point to make h smaller, closer to 0, to make h approach 0,
- to obtain the derivative.
- 2nd. As h gets smaller the secant line EF becomes more like a tangent line.
- 3rd. Try to slide the red point so close to (x, f(x)) that the slope of the secant
- equals the slope of the tangent, the derivative at (x, f(x)).
|
 |
|
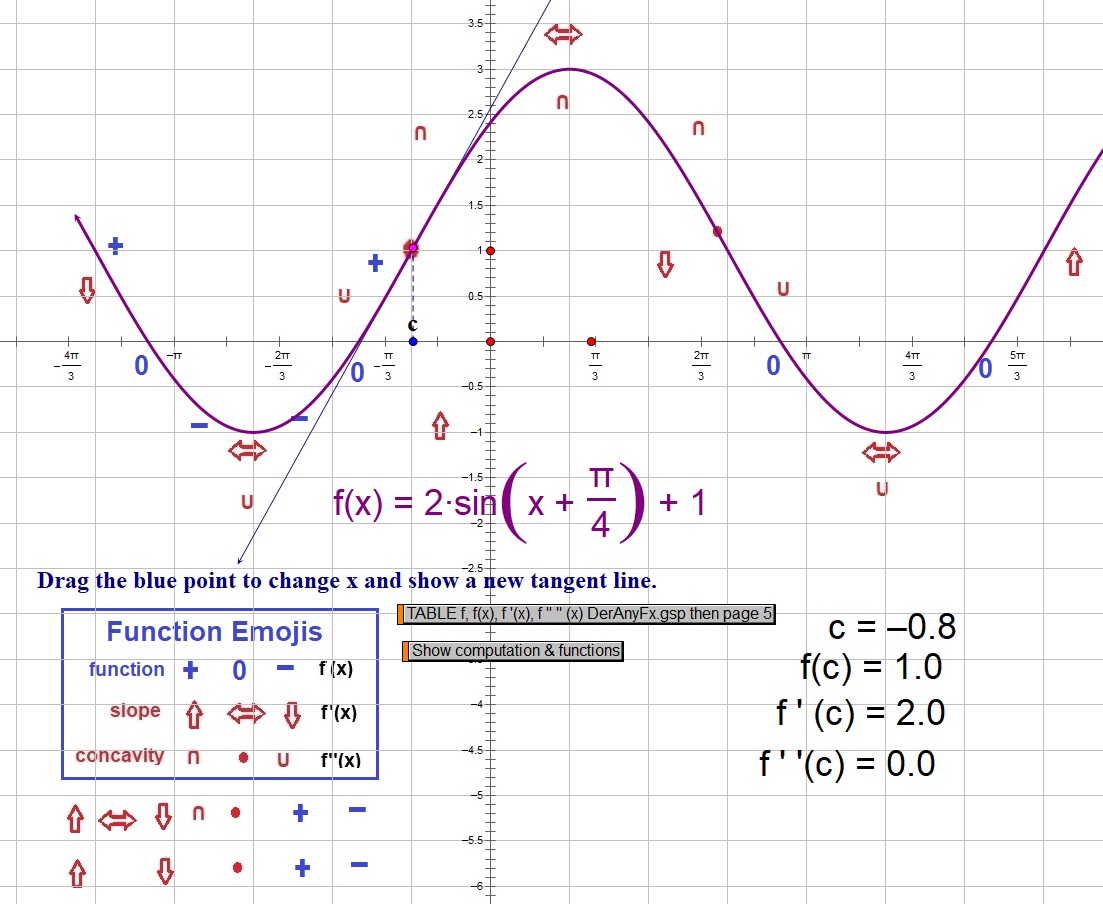
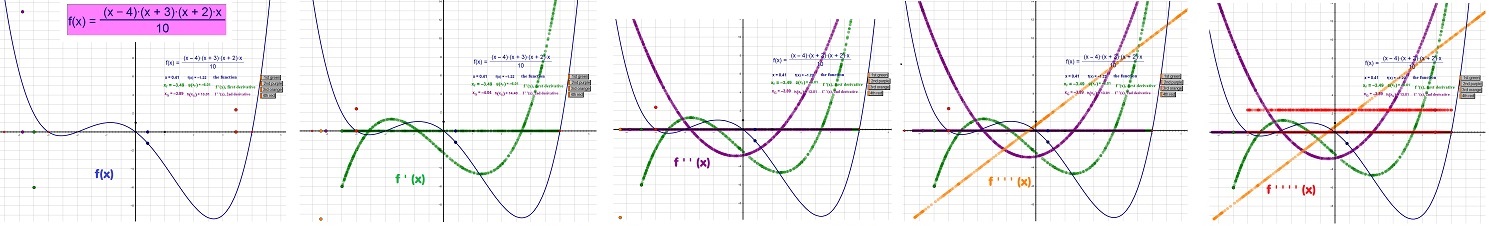
- 3 - DERIVATIVE by m of tangent line, x
- Links
-
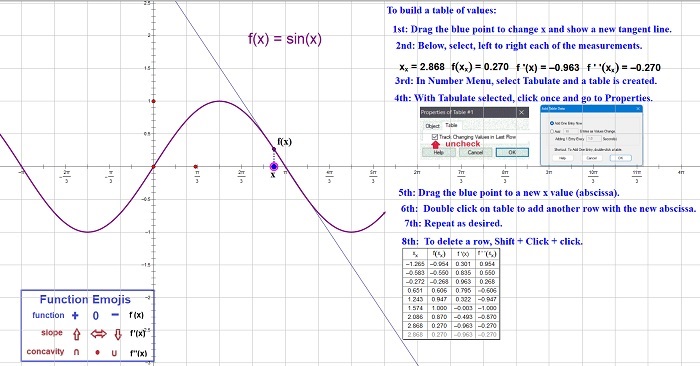
TABLE f, f(x), f '(x), f " " (x) DerAnyFx.gsp then page 5
- also See No. 20 below reguarding "Derivative TABLE found in DerAnyFx.gsp"
- Show computation & functions
-
- Activities
- * Use Ctrl + C to make more emojis as needed.
- * Use emojis to mark status of the function.
- * Find & mark the zeros of the function.
- * Find & mark the zeros of the first derivative.
- * Discuss the status of the function at these points/values.
- * Find & mark the zeros of the second derivative.
- * Discuss the status of the function at these points/values.
- * Find & mark other values of C, f(C), f' (C), f ' ' (C).
- * Discuss intervals over which the function is increasing/decreasing/zero.
- * Discuss intervals over which the function is concave up/down.
- * Summarize as desired.
- * Change the function & repeat the questions/activities.
|
 |
|
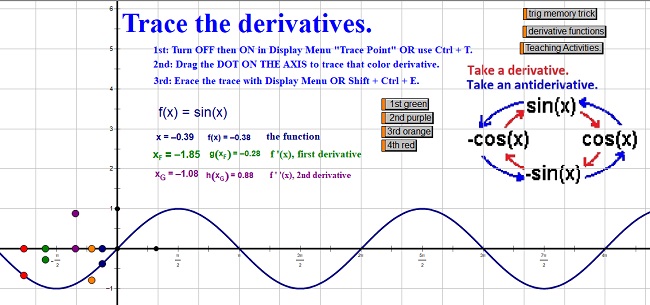
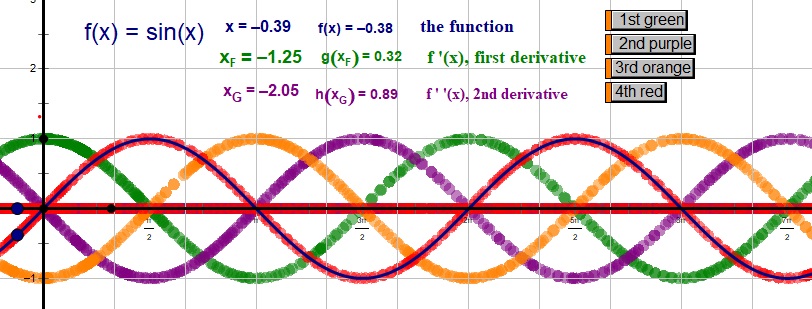
- 4 - DERIVATIVE by trace
- Links
- Hide/show trig memory trick
- Hide/show derivative functions
- Hide/show Teaching Activities.
-
- Hide/show 1st derivitive in green
- Hide/show 2nd derivitive in purple
- Hide/show 3rd derivitive in orange
- Hide/show 4th derivitive in red
-
- Activities
- Trace the derivatives.
- 1st: Turn OFF then ON in Display Menu "Trace Point" OR use Ctrl + T.
- 2nd: Drag the DOT ON THE AXIS to trace that color derivative.
- 3rd: Erace the trace with Display Menu OR Shift + Ctrl + E.
- 4th: Trace the derivatives.
- Teaching activities
- 1. Enable the tracing, trace, name the dot-drawn derivative, record it on the screen w/pen
- 2. Repeat step 1 with second derivative.
- 3. Repeat step 1 with the next derivative.
- 4. Repeat step 1 with the next derivative.
- 5. Reflect on/Discuss the result of all graphs.
- 6. Unhide the memory trick.
|
 |
 |
Partition, Differential, Boxes
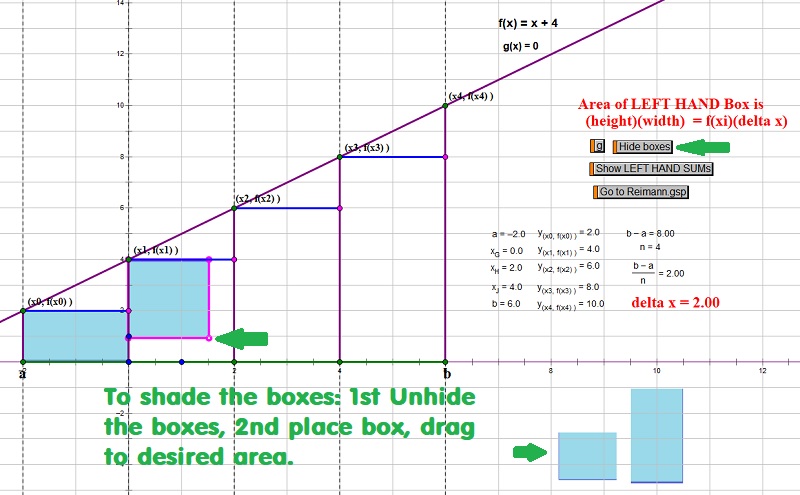
- 5 - PARTITION & SUMS 4 boxes
- Links
- Hide/Show Boxes
- Hide/Show g(x)
- Hide/Show left-hand sums
- Hide/Show g(x)
- Go to
ReimannSums.gsp
-
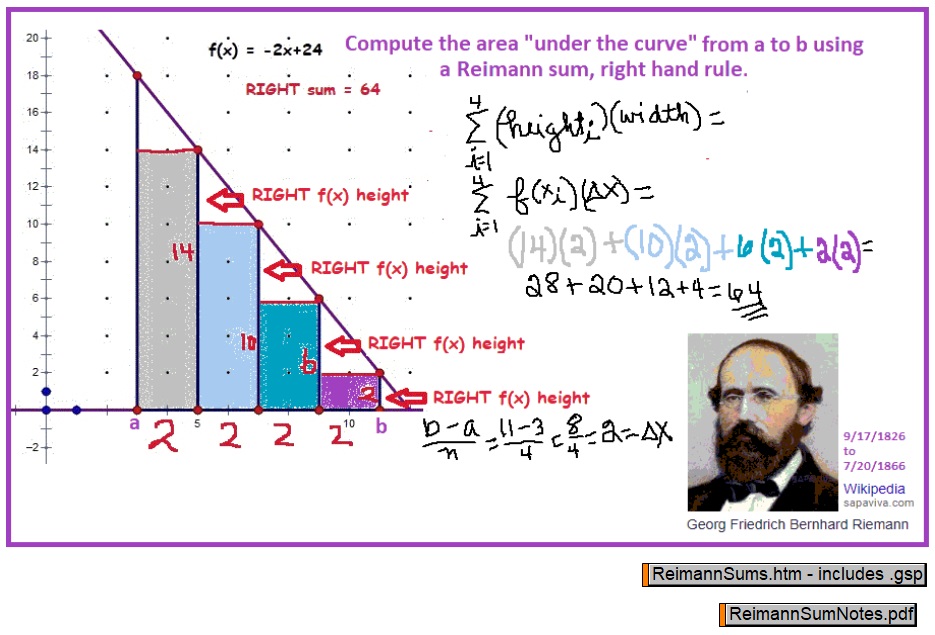
- Notes
- *
Reimann.htm exists and is formated like this page and includes
ReimannSumNotes.pdf and
ReimannSums.gsp
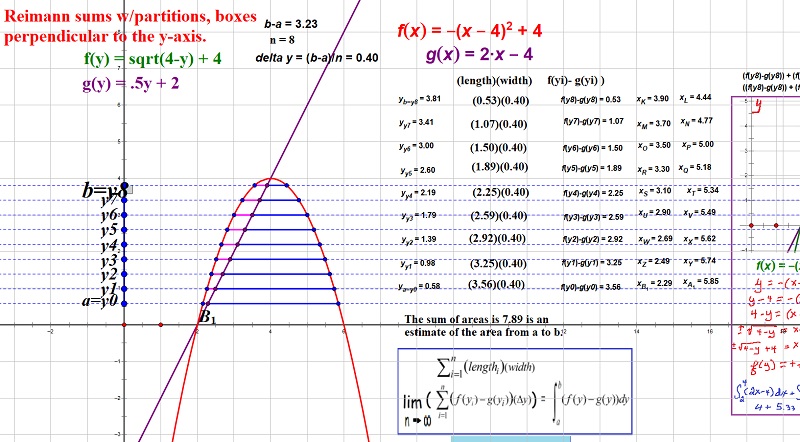
- * The next page shows example of area and sum computation.
-
- Activities
- * Show boxes.
- * Discuss and position left-hand boxes, right-hand boxes, midpoint boxes.
- * Discuss the areas and sum of area of
left-hand boxes, right-hand boxes, midpoint boxes.
- * Move boxes from picture.
- * Change a and b and perhaps f(x).
- * Show boxes and discuss areas.
- * Move boxes from picture.
|
 |
|
- 6 - REIMANN & SUMS
- Links
- *
ReimannSumNotes.pdf
- *
Reimann.htm including
ReimannSums.gsp
-
- Activities
- * Discuss areas, summation meaning & format
- * Perhaps go to links
|
 |
|
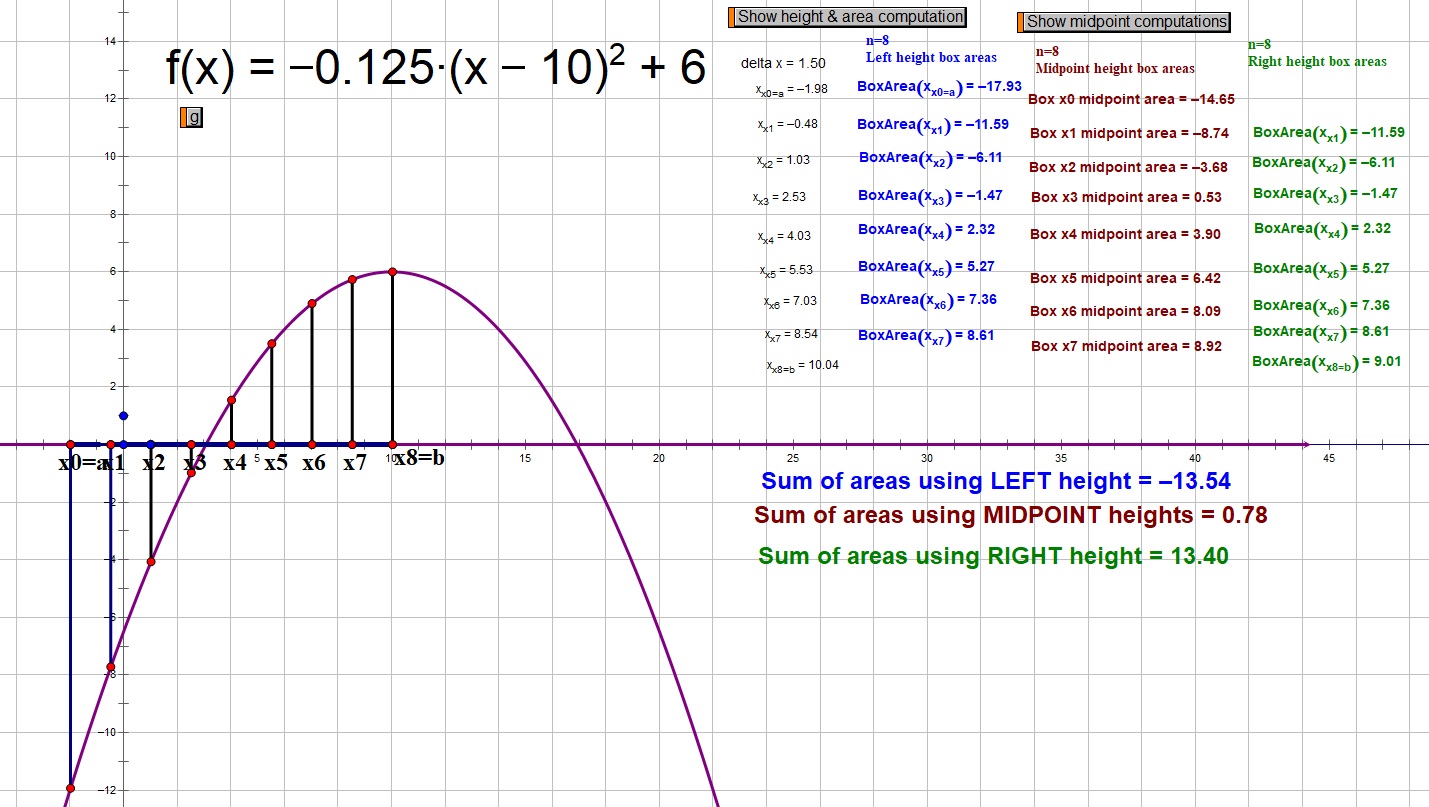
- 7 - SUMS f(x) - g(x), slide end points to change [a, b]
- Links
- Show height and area computation
- Show midpoint coputation
- Show g(x)
-
- Activities
- 1. Start w/g(x) = 0
- 2. Ask can an area be negative?
- * Show negative & positive areas.
- * Show the left vs midpoint vs right turning negative as x is dragged.
- 3. Ask how would increasing the number of boxes effect the area?
- 4. Ask which is the best approach for computation & why?
- 5. Reveal g(x) and discuss height.
- 6. Change f(x), g(x), or both.
- 7. N is small (so the differences in the 3 different sums is large).
Use the midpoint sum to answer this question.
As is, the sum is an approximation of the area under f(x) from a to b.
What is the result if one wishes the sum from b to a?
|
 |
|
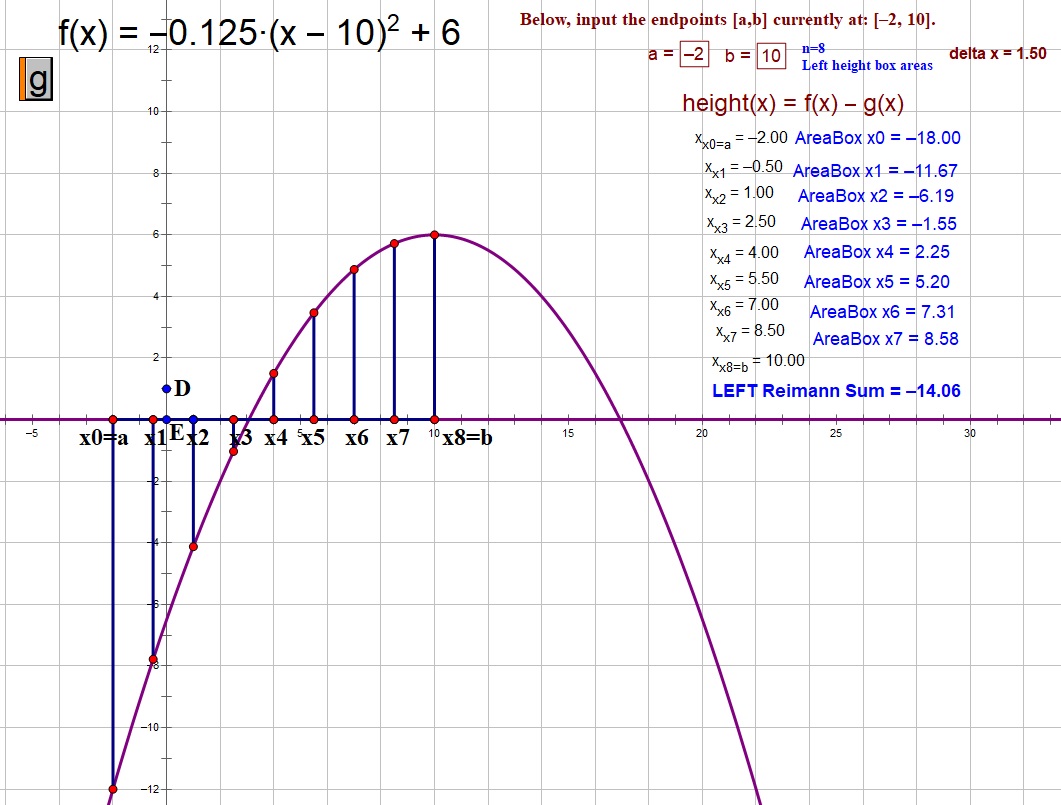
- 8 SUMS f(x)- g(x), input [a,b] in the boxes for a and b
- Note
- This page only provides the left-sum, but provides a
more accurate way to name a and b.
-
- Links
- Show g(x)
-
- Activities
- * Change f(x) to an odd function and ask questions.
- * Change f(x) to an even function and ask questions.
|
 |
|
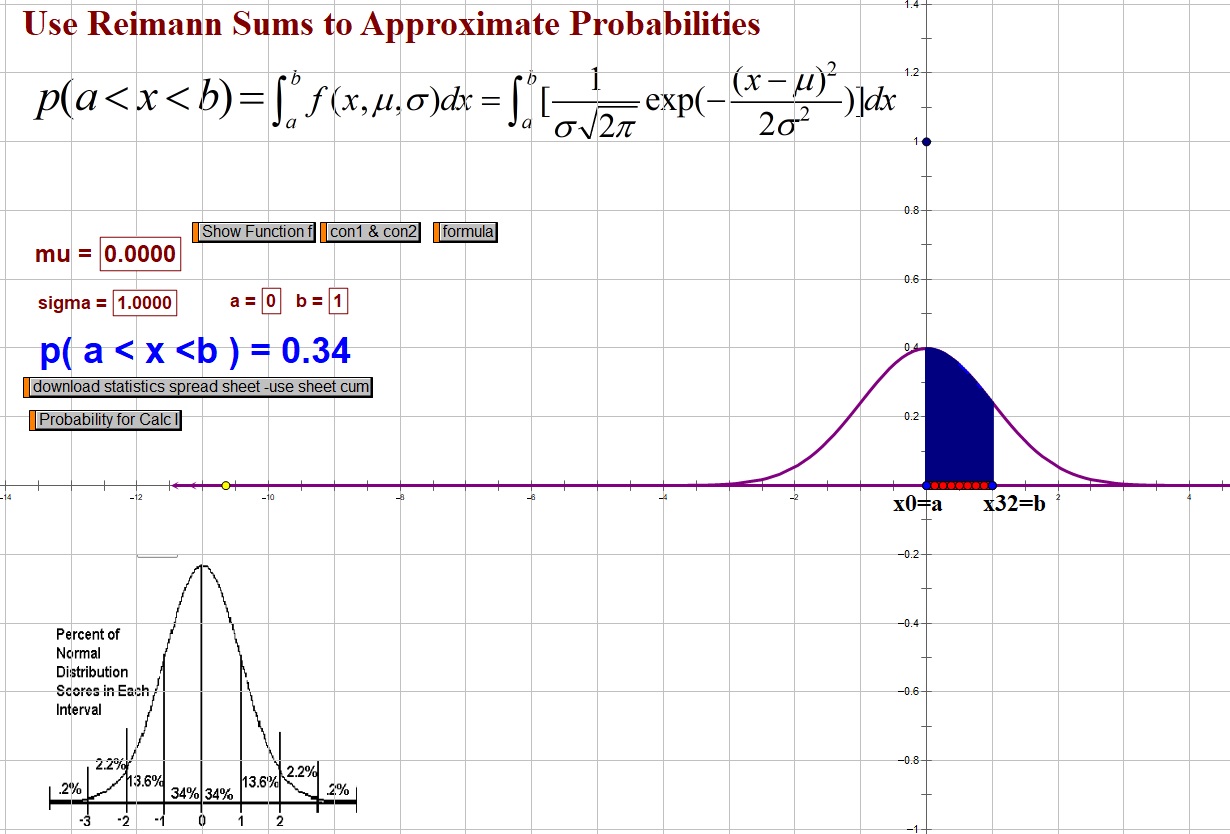
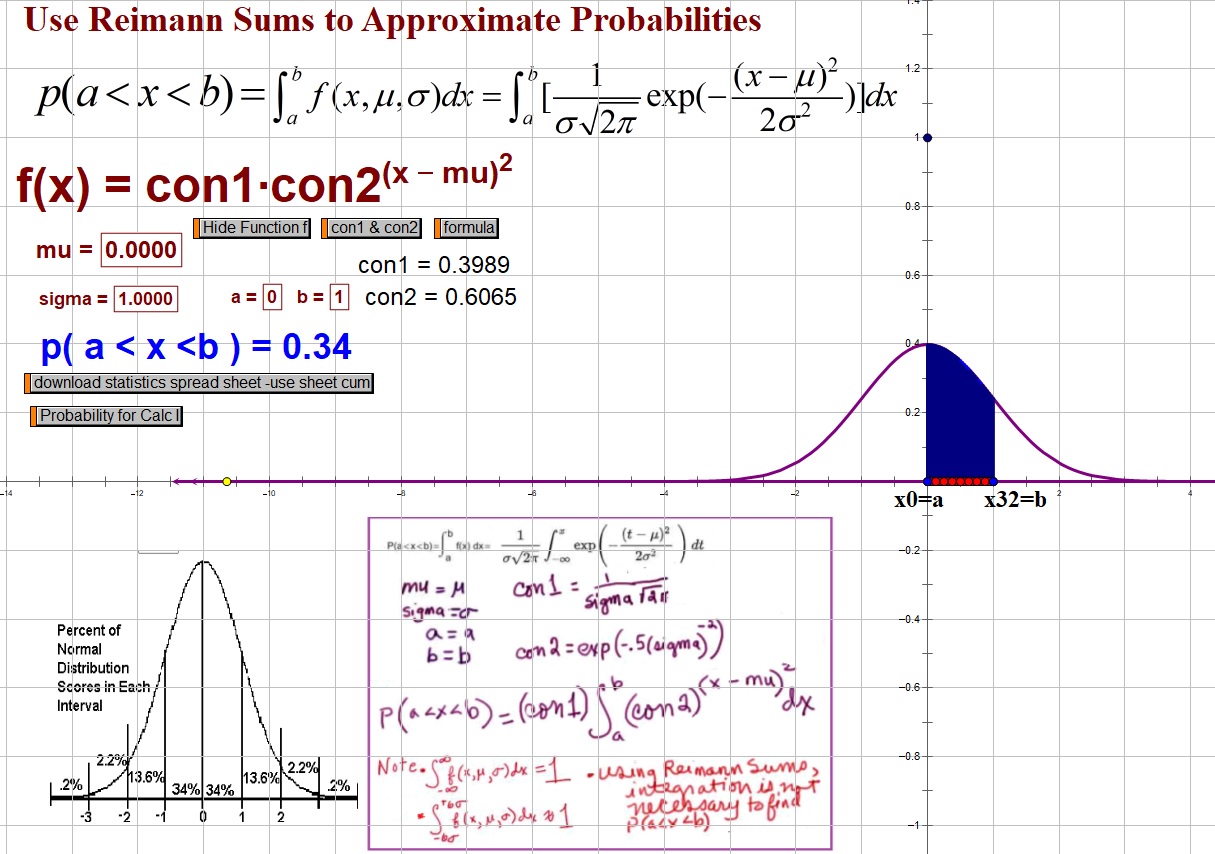
- 9 - CUMULATIVE AREA probability distribution
- Notes
- My calc students don't usually take statistics because they are taking calc.
- This sheet serves as a background and shows a real life example of using an integral.
- N is 32. This is small, compaired to infinite, but large enough to provide a good estimate.
-
- Two images are provided. The top is what the sheet usually looks like.
The bottom shows notes.
-
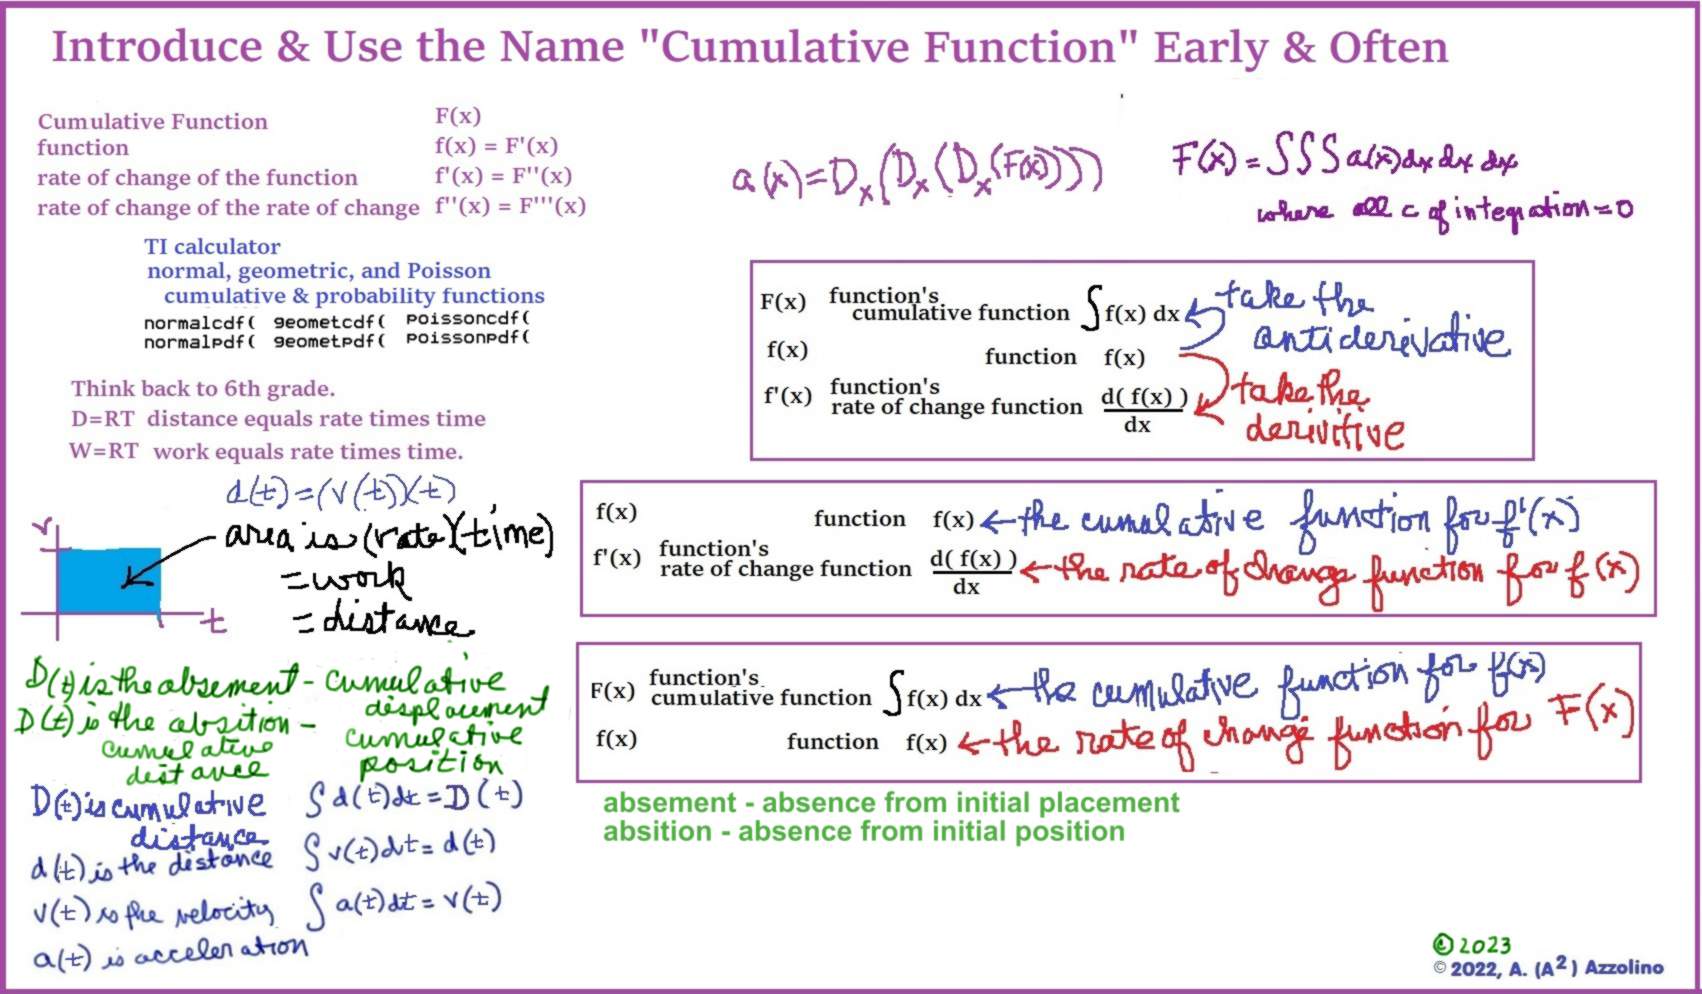
- This also illustrates the use of the term "cumulative" to indicate the integral
of a function and provide/state cumulative results.
-
- Links
- * Show function f(x, mu, sigma)
- * Show constant 1.
- * Show constant 2.
- * Download statistics spreadsheet - use sheet cum
This has an integration function feature.
- * Link to "Probability for Calc I"
This provides a summary of statistics and the normal probability distribution.
-
-
- Activities
- * Play.
|
 |
|
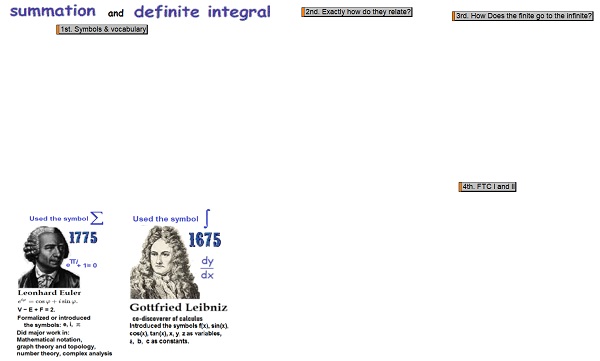
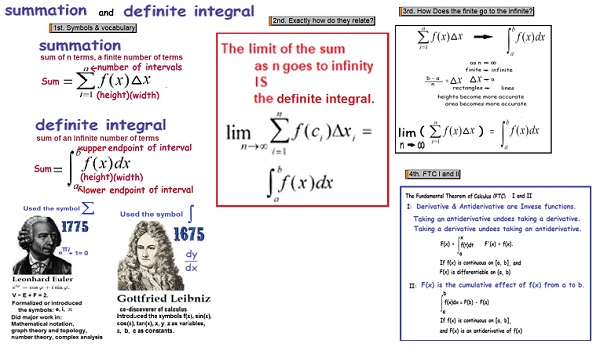
- 10 - HISTORY sum 2 integral
- Links
- 1st. Symbols & vocabulary
- 2nd: Exactly how do they relate?
- 3rd: How Does the finite go to the infinite?
- 4th: FTC I and II
- Activities
- * In order reveal and discuss the notes.
|
 |
|
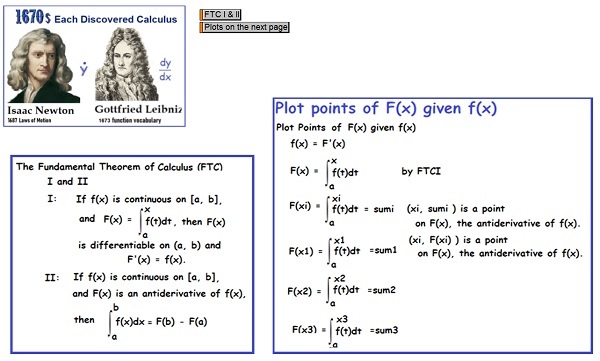
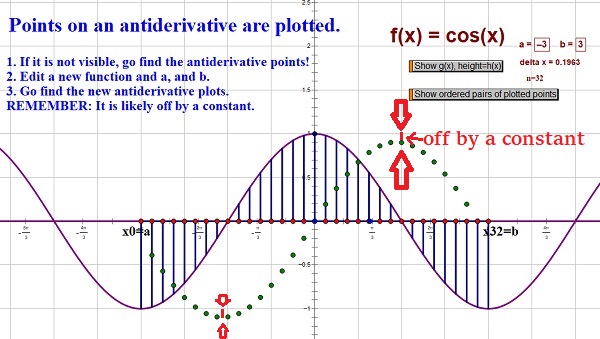
- 11 - INTEGRATION by dots
- Links
- FTC I and II
- Plots on the next page
-
- Activities
- * In order reveal and discuss the notes.
|
 |
|
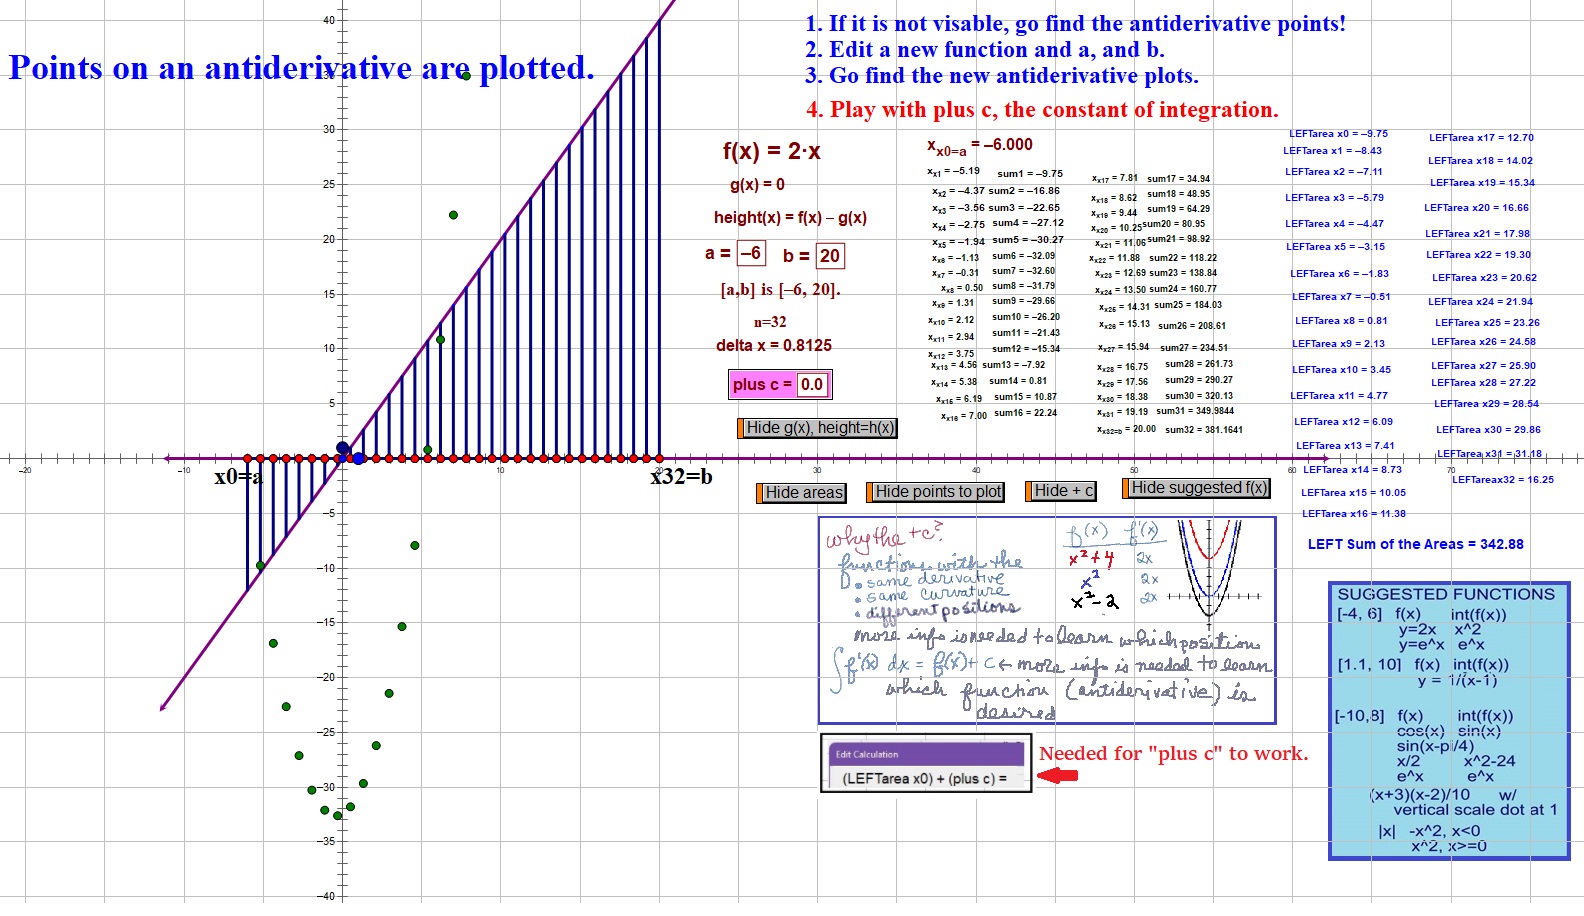
- 12 - INTEGRATION FTC I & FTC II
- Notes: The plotted points are off by a constant. It is an indefinate integral.
Change the parameter "plus c" to adjust the plotted antiderivative points.
-
- Links
- * Show g(x) and height = h(x)
- * Show ordered pairs of plotted points.
- * Show "Why plus c?"
- * Show blue Suggested Functions box.
-
- Activities
- * Change the function as desired.
- * Functions that fit on the screen are suggested.
 |
 |


 fX.f'X.f''X.intX.gsp - The Derivative & Antiderivative Sketchpad
![[MC,i. Home]](http://www.mathnstuff.com/math/spoken/here/1gif/mcihome.gif)

![[Words]](http://www.mathnstuff.com/math/spoken/here/1gif/words.gif)


![[Good Stuff -- free & valuable resources]](http://www.mathnstuff.com/gif/goods.gif)