[tutorials & resource material arranged by topic Class Table

MIDDLE GROUND - Brief Summary of A Hypothesis Test


On This Page On Other Pages


A Brief Introduction
 
      To hypothesis test means to make a judgement based on a statistically analyzed situation.
 
      Below is a picture used in completing a two-tailed hypothesis test,
      "The average is 0. With 95% confidence, test the alternate hypothesis that the average in not 0."
 
      Statistical information about a situation is given or is computed then a decision about the claim is made.
 
      If the evidence falls in the confidence region, there is little evidence to support the new claim.
 
      If the evidence falls in the critical region, there is statistical evidence to support the alternate or new claim.


Vocabulary and Symbols
 
      It has been said, "Statistics means never having to say you are certain." By the end of this page that statement should be clear, now, it is as confusing as the definitions below. Vocabulary has been placed here in two ways. It is placed alphabetically so you can find a specific term easily and in a more unusual format as a step-by-step introduction to hypothesis testing.
alpha
alternate hypothesis
confidence interval
error
level of confidence
null hypothesis
one-tail test
p value
population mean
sample mean
standard deviation
test statistic
two-tail test
type II error
type I error
z-critical
z-score
z-test
 
µ, population mean
 
, sample mean
 
, standard deviation, sigma
      -- the unit for the scale on a hypothesis test. See standard deviation.
 
z, z-score
      -- a standard normal score used to adjust the scale of the data. See z-score.
 
E, error
      -- the maximum distance from the mean that still places a score within the confidence interval
 
confidence interval, µ - E < µ < µ + E
      -- the range of score for which you are confident about the known mean. See confidence interval.
 
z-critical
      -- the boundary value(s) which end the confidence interval.
 
level of confidence, P(µ - E < µ < µ + E)
      -- a probability, usually expressed as a percent, that states how sure you are about the decision made by the test.     ex. Test the null hypothesis at the 90% level of confidence.
      -- probability a score is in the confidence interval containing the mean.
 
ztest or test, or test, test statistic,
      -- usually takes a form similar to
  (observed"new") - (expected"old")
  (test) =
 
(standard error)
      -- the evidence used to accept or reject the null hypothesis.
 
H0, null hypothesis
      -- a statement which is already accepted to be true.
      -- what you really want to "disprove."
      -- ex. In some hypothesis test, H0: µ = 12.
          The null hypothesis is: The mean is 12.
 
H1, alternate hypothesis
      -- a statement which contradicts the null hypothesis.
      -- what you really want to "prove."
      -- ex. In some hypothesis test, H1: µ 12.
          The alternate hypothesis is: The mean is not 12.
 
type I error
      -- Reject the null hypothesis when the null hypothesis is true.
 
type II error
      -- Do not reject the null hypothesis when the null hypothesis is false.

 
, alpha
      -- P(type I error)
      -- P(Ho is true but is rejected) = 1 - (level of confidence). The area under the curve, or the probability, corresponding to the tail(s) rather than the interval about the mean.   Note: If the level of confidence is 90%, alpha is 1- .90 or 10%.
 
/2, alpha over 2, half of alpha
      -- The probability or area under each tail of a two-tail test   Note: If the level of confidence is 90% in a two-tail test, then alpha is 1- .90 or 10%, and /2 is 5% ,so, 5% of the scores are expected to fall in each tail.
 
one-tail test
      -- used when the alternate hypothesis, H1, is
µ > k or µ < k, where k is the null hypothesis mean.
 
two-tail test
      -- used when the alternate hypothesis, H1, is µ k, where k is the null hypothesis mean.
 
p value
      -- the probability a score is in the extreme of the test statistic.


Never Certain
 
      Before reading this section review the good news The Data Is Centered About the Mean-Mode-Median, then, get ready for the bad news.
 
 
      The bad news is one is never certain where the data will fall. Though the normal distribution data is centered about the mean, one can't tell for certain if a specific score will be close to the mean or far from the mean.
 
      It doesn't matter what kind of things the scores are: raw scores, x, with a mean of , or sample means, , with a population mean of µ. One can not be certain, but, for a two-tail test these distribution of scores are very useful.
 
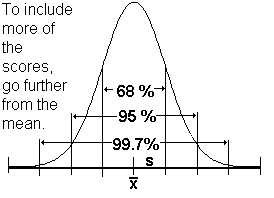
      Because 68% of normally distributed scores fall within one standard deviation of the mean, one might expect 68% of the scores drawn at a certain time to be within 1 standard deviation of the mean, but this is not guaranteed. One is never certain, but one can be 68% certain about the decision made on a two-tailed hypothesis test if this useful information is used.
 
      If we wished to have a 68% confidence level about our hypothesis test, we would go one standard deviation from the mean, z-scores from -1 to 1. See change the scale.
 
      If we wished to have approximately a 95% confidence level, at 5%, about out hypothesis test, we would go two standard deviation from the mean, z-scores from -2 to 2.
 
      It is important to note that even if at 95% confidence level, 5% of the scores will fall outside this confidence interval and this is expected and the reason one says, "Statistics means never having to say you are certain." More on that later.
 
      If we wished to have approximately a 99.7% confidence level about out hypothesis test, we would go three standard deviation from the mean, z-scores from -3 to 3.
 
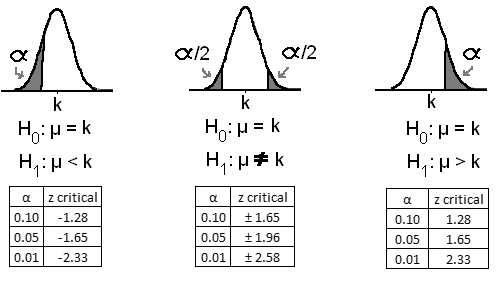
      More exact intervals are listed below organized by , alpha.
 
      The above table of z-scores, used as critical scores, means if we wished to have 99% confidence in our test results on a two-tailed test, we'd go 2.58 standard deviation from the mean, z-scores from -2.58 to 2.58.
 
      If the score falls in this interval, we do not reject the null hypothesis. If the score falls outside the confidence interval, in either of the critical intervals greater than 2.58 or less than -2.58, we can with 99% confidence reject the null hypothesis.
 
      Again recall, even at 99% confident, there is still the possibility of a decision error, the topic of a later section.


A Typical Hypothesis Test
 
      For the purpose of discussion, a large scale hypothesis test concerning a population mean is presented. The population is known to be normally distributed.
 
      The test statistic is computed using
ztest = ( - µ)/(/(n))
 
      A list of steps in performing a hypothesis test follows.
  1. Identify the type of situtation, large sample, small sample, test of the mean, test concerning difference between means, etc.
  2. Identify the kind of sample statistic that is needed and be sure you have all the info to run a test with this sample statistic.
  3. (Optional) Draw and label a diagram to indicate what is going on in the problem and where the data falls.
  4. State the null and an appropriate alternal hypothesis.
  5. Compute the test statistic.
  6. Accept or reject the null hypothesis based on the value or location of the test statistic.
  7. Draw a conclusion, write a statement, including a phrase concerning the level of confidence, concerning the test decision.


Example Problems
 
  ex. 1
      A normally distributed standardized math test is known to have a mean of 70% and a standard deviation of 12%. The test is given to 36 freshmen and the class average is 75%. With 99% confidence, complete a hypothesis test to see if the population average is not 70%.

3. Draw and label a diagram to indicate what is going on in the problem and where the data falls.
   
4. State the null and an appropriate alternal hypothesis.
   
5. Compute the test statistic.
   
6. Accept or reject the null hypothesis based on the value or location of the test statistic.
      In step 7, the usual format of the hypothesis test is displayed, however, using a calculator to compute the confidence interval of 99%, it may be noted that the test statistic of 75 is well within the confidence range. So the null hypothesis is not rejected.
   
   
7.Draw a conclusion, write a statement, including a phrase concerning the level of confidence, concerning the test decision.
   
 
  ex. 2
      A normally distributed standardized math test is known to have a mean of 70% and a standard deviation of 12%. The test is given to 36 freshmen and the class average is 75%. With 99% confidence, complete a hypothesis test to see if the population average is greater than 70%.


Type I and Type II Errors
 
      If you've read the above parts of the page, you should have a good feel for how the data is distributed, where the confidence interval lies, where the critical value(s) lie, and where the test statistic might lie.
 
      Type I and type II error, the statistical error under discussion, are not like an error in arithmetic on a math test. These are error based on full knowledge of statistics and being very deliberate about work.
 
      Recall, from above, "It is important to note that even if at 95% confidence level, 5% of the scores will fall outside this confidence interval and this is expected and the reason one says, "Statistics means never having to say you are certain."
 
      In light of what you now know, it might be nice to change the definitions of the events which are called errors, but, statisticians all know the meaning of the terms and do not find that necessary. So, just know the meaning and don't be bothered by the term.
 
type I error
      -- Reject the null hypothesis when the null hypothesis is true.
 
type II error
      -- Do not reject the null hypothesis when the null hypothesis is false.
 
      If you wish to avoid these errors you might collect more data so the sample is larger or run another study so you have another sample statistic to test.


P-value
 
      Recall, from above, the p-value is "the probability a score is in the extreme of the test statistic."
 
      The p-value gives you the level of confidence you have in a one-tail test if you compute 1 - (p-value).
 
      The calculator makes the computation easy, something not available before calculators.
 

[MC,i. Home] [Table] [Words] Classes [this semester's schedule w/links] [Good Stuff -- free & valuable resources] [last] [next]
© 2012, 2022 Agnes Azzolino
www.mathnstuff.com/math/spoken/here/2class/90/htest.htm