Class Table "Why = a(x - h)² + k?" -- EVERYTHING ... ABOUT A QUADRATIC ...
Graphing Quadratics:
Interactive Graphs of y=ax² + bx + c and y=a(x-h)² +k
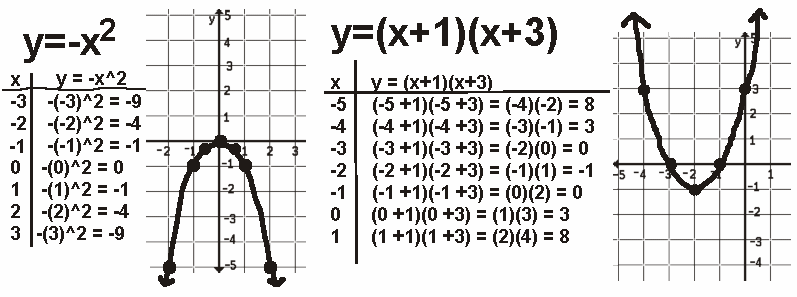
By Point-Plotting -- Plot (x,y)
What You Should Notice -- Shape, Intercepts, Concavity
By Intercepts -- Using y=a(x-d)(x-e)
By Inspection -- Using y=a(x - h)² + k
Graphing Questions -- All Sorts


Graphing by Point-Plotting

      A graph is a portrait. It is a detailed picture of everything a rule does. For more information on what a graph is, see A Graph is A Portrait.

      Early in the study of algebra, Algebra I, the chief technique to produce a graph or portrait is point-plotting. For a short animating see Point-Plotting Animation.

      In order to create a graph, a canvas or coordinate plane is required. Graph paper is available on the Planes and Masters Page.

    Here's instructions on how to point-plot a graph.
  • Consider possible values for x and also restrictions on the values of x -- like 0 in the bottom of a fraction.
  • For x, use -1, 0, 1, numbers greater than 1, numbers less than -1, numbers between -1 and 0, and also between 0 and 1.
  • Generate ordered pairs.
  • Plot the points.
  • Look for a pattern.
  • Generalize and sketch the curve.

      A thorough examination of point-plotting work might be sufficient. Examine the work just below.


Things You Should Notice
    y = (x+1)(x+3)
  • a parabola
  • U-Shaped Curve
  • Curve opens Up
        - Concave Up
  • Axis of Symmetry:
        x = -2
  • x-intercept
        is at x is -3 and -1

      Compare the info and the curve for each of the two above examples. See if you can determine information about the graph just by looking at the equation. It is important to be able to do this if you wish to avoid point-plotting.

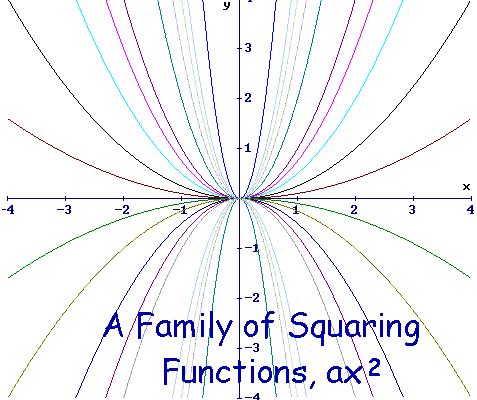
      By now you should recognize a quadratic, with 2 as the highest degree in the equation, and know the curve it creates is a parabola. Examine the coefficient of the quadratic term since it determines the shape and concavity of the parabola.


The Coefficient of the Quadratic Term,
the "a" in y = ax2 + bx + c

    In each of the equations

    y = a(x - h)2 + k, and, y = ax2 + bx + c,

the a, the coefficient of the quadratic term, has more influence on the function than the other constants. It determines the shape and concavity of the curve.

The coefficient, a, effects the quadratic in the following ways.
a > 1 -- steep, skinny, concave up
a = 1 -- normal and concave up
0 < a < 1 -- shallow, flattened, fattened, concave up
0 -- the curve is not quadratic
-1 < a < 0 -- shallow, flattened, fattened, concave down
a = -1 -- normal and concave down
a < -1 -- steep, skinny, concave down


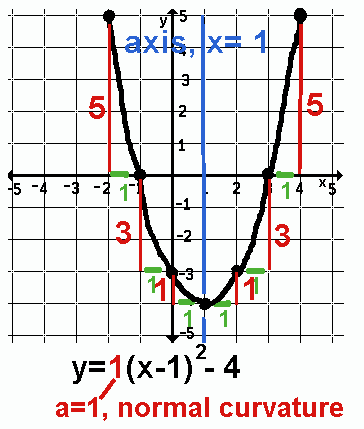
Use The 1, 3, 5, 7, 9, ... Shape
to Reduce Point-Plotting

    If the coefficient of the quadratic term is 1 or -1, the parabola is neither fat nor skinny but normal.

    The curvature on a normal parabola is a rise/fall of 1, then 3, then 5, then 7, then 9, then 11, then 13, and so on for each 1 unit it runs from the vertex. The steepness of the curve changes in exactly this way.

    If the coefficient of the quadratic term is 2 or -2, the curvature is a rise/fall of 2, then 6, then 10, then 14, then 18, for each unit it runs from the vertex -- double the odd integers.

    The trick now is to find either the vertex or the x-intercept so the graph may be drawn with little point-plotting.


Graphing by Intercepts

    After learning the dilation from the coefficient of the quadratic term, find the x-intercepts.

    Set the expression equal to 0 and solve for x to find the x-intercepts of a graph. In many equations, this computation may be completed mentally.

Graph y=(x+3)(x+1) becomes
Solve 0=(x+3)(x+1)
0=(x+3) or 0=(x+1)
x=-3 or x=-1
So (-3,0) and (-1,0) are x-intercepts.
Plot these points and fit the curve.

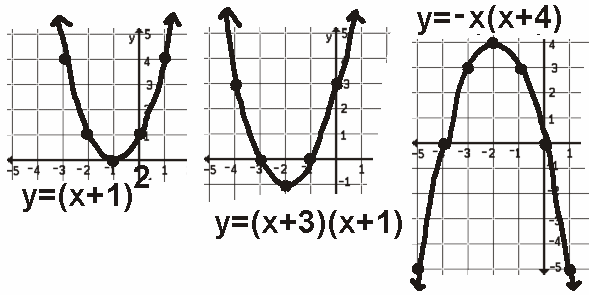
    On y=(x+1)² the x-intercept is at -1. This is the vertex since only one value is on the horizontal line y=0. Draw the parabola with a normal dilation.

    On y=(x+3)(x+1), the x-intercepts are at -3 and -1 -- 2 units apart. The vertex is exactly half way between these numbers and 1 unit down at (-2,-1).

    On y=-x(x+4), the x-intercepts are at 0 and -4 -- 4 units apart. The parabola is concave down with a normal dilation. Fit the parabola the the known points.


Graphing by Inspection

    Sometimes it's easy to graph by inspection. Sometimes it's not.

    If the quadratic is written as y = a(x - h)² + k, it's easy.

    If the quadratic is written as y = ax² + bx + c, it's not as easy.

    Two "shifts" are stated in y = a(x - h)² + k.

    There is a " domain shifts" forced by the (x - h). It positions the curve left and right.

    There is a " range shifts" forced by the + k. It positions the curve up and down.
    See Composition of Functions and the how functions are created.

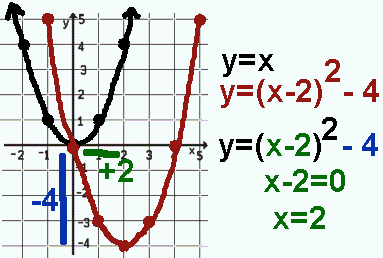
    See the graph of y = (x - 2)² - 4 from a composition of functions standpoint.

      See Curve Shifting and this graph and function explained in detail.

      In the curve y = (x - 2)² - 4, the squaring, symbolized by 1()² gives the curve its shape and dilation. The (x-2) "recenters" the curve horizontally from a axis of symmetry of x=0 to an axis of symmetry of x-2=0 or x=2. The - 4 "shifts" the curve down 4.
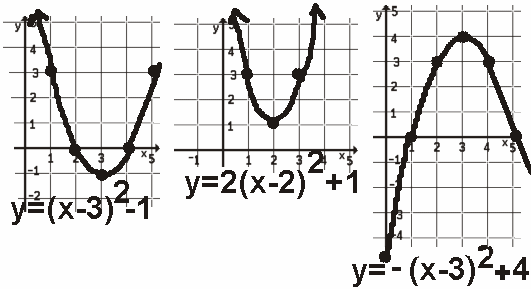
    The graph y=(x-3)²-1 is shifted to the right 3 and down 1 compared to the curve y=x².

    The graph y=2(x-2)²+1 is dilated and made steeper or "skinny" and shifted right 2 and up 1.

    The graph of y=-(x-3)²+4 is concave down with normal dilation, shifted to the right 3, and shifted up 4.


Questions.
7,8
Qu. 1 - 6: Graph by any method.
1. y=(x+2)²
2, y = -(x-2)² + 4
3. y = (x-4)(x-2)
4. y = (x+1)² + 2
5. y = - (x+3)²
6. y = x² - 1/2
Answers 1 - 6
Qu. 7 - 8: State the equation given the graph.
MouseOver for answer: 7y=(x+4)^2 - 5   8y=(1/2)x^2-3
Qu. 9 - 10: State the equation given the info.
9. a concave up parabola with normal dilation and x-intercepts at -3 and 1.
MouseOver for answer y=(x+3)(x-1)
10. a concave down parabola of normal dilation with a vertex at (2,3).
MouseOver for answer y=(x-2)^2 + 3


Class Table [MC,i. Home] [Words] Classes [this semester's schedule w/links] [Good Stuff -- free & valuable resources]
© 2007, Agnes Azzolino
www.mathnstuff.com/math/spoken/here/2class/320/qgraph.htm