


Graphing Calculator's Zooming Feature
| Intro | |
| | |
| | NOTES:
- No points have been marked on this page for BREAKs. Decide for yourself when to break.
- Keep
notes open.
On this pages find notes on: - The Purpose of Zoom
 - How to Zoom

|
| Why Zoom? | |
| | |
| |
-
WINDOW and
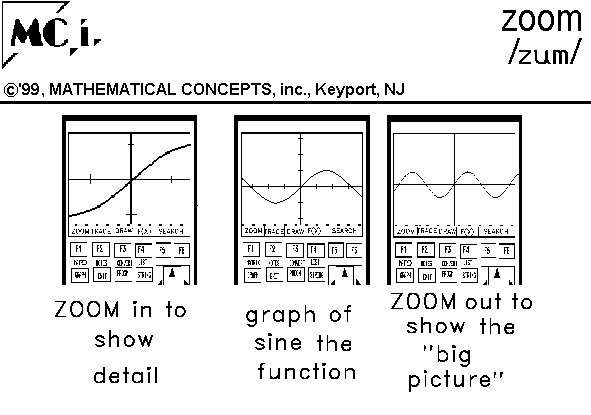
ZOOM are two feaautres that facilitate viewing a graph
and reading approximate values of data from the graph using TRACE.
- WINDOW features set individual window parameters -- like the left-most x
value (Xmin) or the right-most x value (Xmax) -- and are used when one knows some information about
how a graph looks and wishes to adjust the details of the viewing screen.
- ZOOM features adjust more than one window parameter quiclky, simultaneously.
[Perhaps the speed at which this happens reminds one of the speed of a racing vehicle as it zooms by.]
Some ZOOM options are listed below.- BOX - (explained below) enlarges a rectangular box on the existing graphing window.
- IN - resizes the screen in (showing more detail) on a preset scale using the curser value as a center.
- OUT - resizes the screen out (showing more of the entire graph but with less detail) on a preset scale using the curser value as a center.
- STANDARD - returns the viewing window to the default window centered at the
origin and displayed so the axes (the
x-axis and
y-axis)are square, or have the same scale.
- PREVOIUS - returns to the previously used viewing window.
- SQUARE - adjust the window, centered around the curser, so the axes are the same scale.
- Below, ZOOM BOX is described.
| |
| How to ZOOM BOX | |
| | |
| |
- 1st: Store the function in the y= menu.
-
- 2nd: Press the GRAPH key to display the graph of the function.
-
- 3rd: Press TRACE and move to the right or left on this function to display a
decimal approximation of the x value and the y value, the value of the function.
-
- 4th: If the decimal approximation of the y value changes in the first
two decimal digits, it is necessary to redraw the function with a different viewing
window.
-
- 5th: Press
ZOOM then 1 for BOX to
return to the graph to select the corner of a new window.
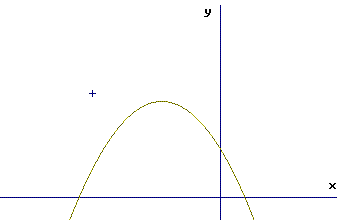 -
- 6th: Move the curser to a point which will serve as one corner of a new viewing window.
- I like keeping the viewing window the same shape as the viewing window of
the calculator. I pick a corner which builds this shape
rectangle about the region of the graph which needs enlargeing.
-
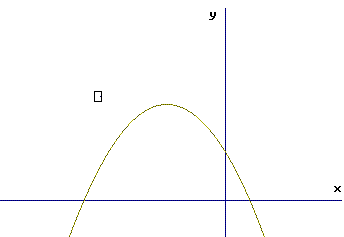
- 7th: Press ENTER to make the corner "stick" and watch how the curser changes
shape on the screen.
-
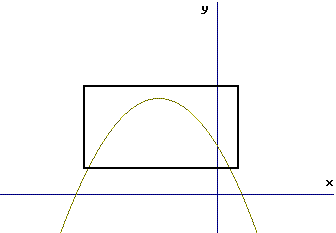
- 8th: Move the curser to the diagonally opposite corner and watch as
the new rectangular screen is created by your use of the curser.
-
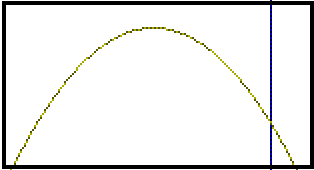
- 9th: Press ENTER to make the corner "stick" on the new corner and
watch as the graph is redrawn with better resolution.
 -
- 10th: Repeat steps 3 through 9 until curser movement does not produce a
change in the first two decimal digits of the y value.
-
d.) To keep a function in storage but not display the graph,
- 1st: Go to the y= menu
- 2nd: Move to the equal sign on the line with the desired function.
- 3rd: Press ENTER (on a TI82 or TI83) so that the equal sign is no longer highlighted.
- 3rd: Press Deselect (on a TI85 or TI86) on the soft key pad.
| |


This page is brought to you by MATHEMATICAL CONCEPTS, inc., publishers of
MATH SPOKEN HERE!, ISBN: 0-9623593-5-1.
You are hereby granted permission to make ONE printed copy of this page
and its picture(s) for your PERSONAL and not-for-profit use. YOU MAY NOT MAKE
ANY ADDITIONAL COPIES OF THIS PAGE, ITS PICTURE(S), ITS SOUND CLIP(S), OR ITS ANIMATED
GIFS WITHOUT PERMISSION FROM:
classes@mathnstuff.com or by mail to the
address below.


![[MC,i. Home]](http://www.mathnstuff.com/math/spoken/here/1gif/mcihome.gif)
![[Order form]](http://www.mathnstuff.com/math/spoken/here/1gif/orders.gif)
![[MSH! Home]](http://www.mathnstuff.com/math/spoken/here/1gif/mshhome.gif)
![[Transcription]](http://www.mathnstuff.com/math/spoken/here/1gif/spoke.gif)
![[Table]](http://www.mathnstuff.com/math/spoken/here/1gif/table.gif)
![[Words]](http://www.mathnstuff.com/math/spoken/here/1gif/words.gif)

![[top]](http://www.mathnstuff.com/math/spoken/here/1gif/top.gif)
![[end]](http://www.mathnstuff.com/math/spoken/here/1gif/end.gif)