 Comments ...
Project Info - Hi,
- The course outline says you are to "collect data (n=35) and construct 90% CI estimate for mean
home cost in Edison NJ" but you do not meet in a class and no data has been supplied for online courses, so,
"we punt," and that means much more work for me as it has this whole semester.
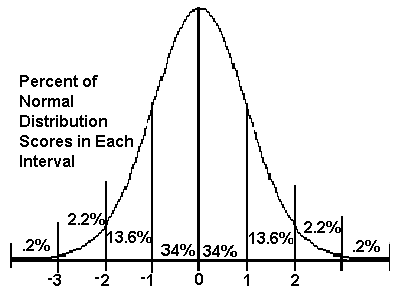
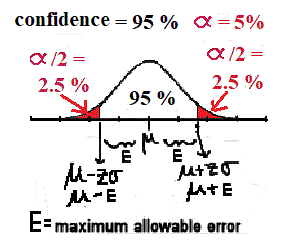
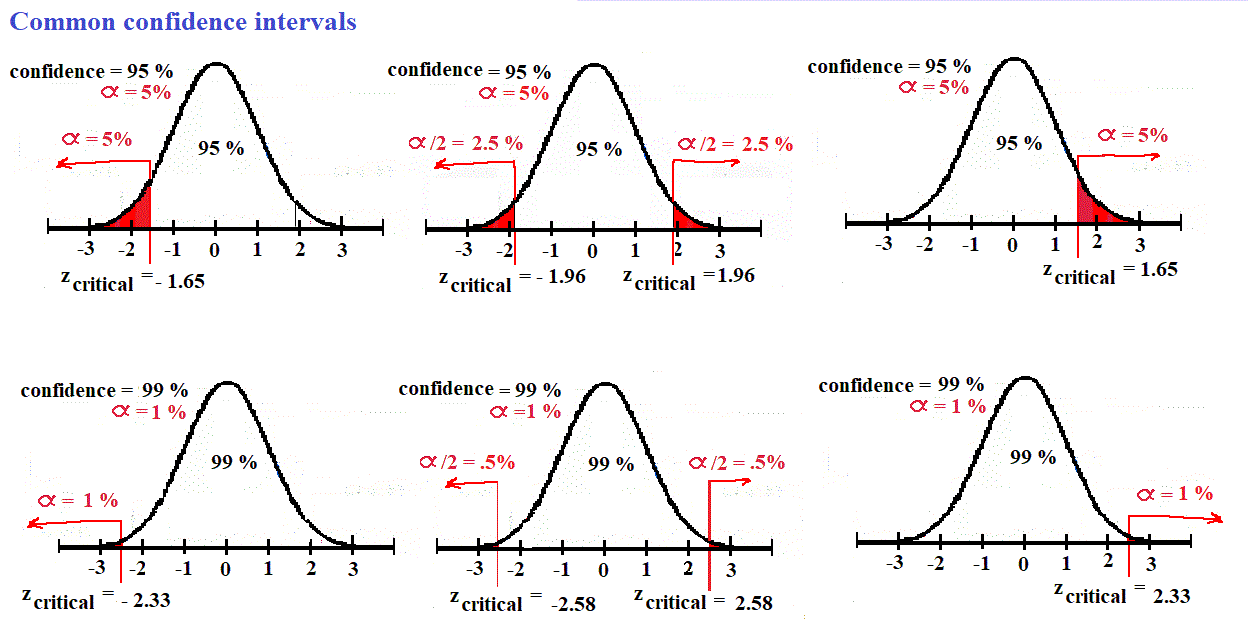
- Because I posted support material for confidence interval and hypothesis testing
for last week, you should already have a good idea of what to expect.
- Below are the Rutgers titles from:
The New Jersey MOD IV Historical Database, mod_iv_year: 2024
by Mr. Marc Pfeiffer & Lucas Marxen that I am considering to use as possible title from which you
may choose a project to study.
- As stated last week, the project has two parts: a. a 1-variable statistical analysis
(which must also include your choice of statistical illustration) and a hypothesis test (testing a hypothesis of
your choice, including alpha, and the type of test you feel appropriate) AND THE TOPIC YOU DID THE
1-VARIABLE ANALYSIS and confidence interval on.
- The course outline requires you to "collect data (n=35)
and construct 90% CI estimate for mean home cost in Edison NJ." You will collect data IN THE SPREADSHEET
I SUPPLY and construct whatever % confidence interval seems appropriate on whatever topic is listed in
the spreadsheet.
- Instead of the department's Friday 4/25 assignment/lab, you will be handing in
Part A of the project.
- Sample of confidence interval presentation and also 1-variable statistice notes
and ways to produce an illustration are shown below. You are also welcome to use a spreadsheet from a prior
class or a web page as found on OMNI.
- I will likely have the spreadsheet by Wednesday. For now make sure you have
completed at least your study of confidence interval in the book and with the sources below.
- Go with confidence. Stay safe, A2
| |