2/17
- I. For homework:
- page 114 # 82
- page 127 # 75
- II. Problems from the book:
- pg 125 # 25, 29, 45, 46, 56, 59, 60, 61, 62
- III. Vocabulary:
-
The greatest integer function
is a nickname for the greatest integer less than or equal to the specific number function.
- IV. Calculator Techniques
- a.) Many calculators list the greatest integer function in MATH, NUM (for number), int().
- b.) If you wish the calculator to display
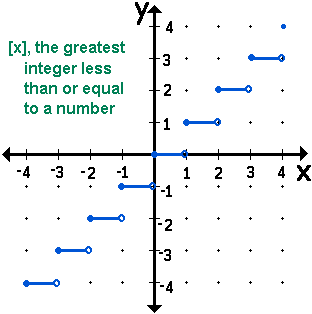 not not  - go to MODE and select DOT not CONNECT.
-
- c.) To read from a calculator screen to 2 decimal place accuracy the
maximum value of a function (some y value) use the following calculator features.
- 1st: Store the function in the y= menu.
-
- 2nd: Press the GRAPH key to display the graph of the function.
-
- 3rd: Press TRACE and move to the right or left on this function to display a
decimal approximation of the x value and the y value, the value of the function.
-
- 4th: If the decimal approximation of the y value changes in the first
two decimal digits, it is necessary to redraw the function with a different viewing
window.
-
- 5th: Press
ZOOM then 1 for BOX to
return to the graph to select the corner of a new window.
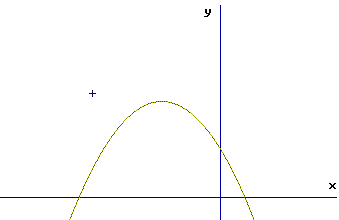 -
- 6th: Move the curser to a point which will serve as one corner of a new viewing window.
- I like keeping the viewing window the same shape as the viewing window of
the calculator. I pick a corner which builds this shape
rectangle about the region of the graph which needs enlargeing.
-
- 7th: Press ENTER to make the corner "stick" and watch how the curser changes
shape on the screen.

-
- 8th: Move the curser to the diagonally opposite corner and watch as
the new rectangular screen is created by your use of the curser.
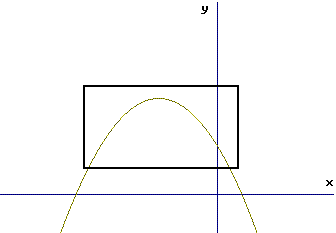
-
- 9th: Press ENTER to make the corner "stick" on the new corner and
watch as the graph is redrawn with better resolution.
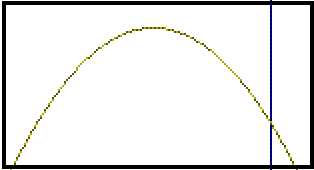 -
- 10th: Repeat steps 3 through 9 until curser movement does not produce a
change in the first two decimal digits of the y value.
-
- d.) To keep a function in storage but not display the graph,
- 1st: Go to the y= menu
- 2nd: Move to the equal sign on the line with the desired function.
- 3rd: Press ENTER (on a TI82 or TI83) so that the equal sign is no longer highlighted.
- 3rd: Press Deselect (on a TI85 or TI86) on the soft key pad.
2/22
- I. In your notes, sketch each and place work in two columns as shown.
1. y = x
 |
2. y = x²  |
3. y = x3  |
4. y = x4  |
5. y = x5  |
6. y = x6  |
7. y = 1/x  |
8. y = 1/x²  |
- II. Sketch, state domain, range.
- 9.) (x-2)2
- 9a.) -x2 + 3
- 10.) |x|
- III. Vocabulary
-
polynomial
asymptote
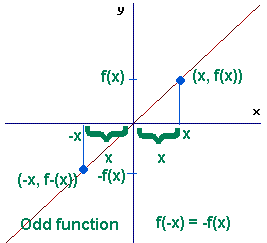 odd function
f(-x) = -f(x) odd function
f(-x) = -f(x)
Ex. f(x)=sin(x)
Ex. y = 1/x
 even function
f(-x) = f(x) even function
f(-x) = f(x)
Ex. f(x)=cos(x)
Ex. y = 1/x²
- IV. Decomposition (taking apart) of functions -- Sketch then determine the
functions which produced the function
- 12. y = (x + 1)2
- 13. y = x2 + 1
- 14. f(x) = sqrt(x) - 2
- 15. g(x) = sqrt(x - 2)
- Answers 12-15
- V. Composition (creating from other) of functions -- chapter 1, section 6
- sum (f + g)(x)
- difference (f - g)(x)
- product (f · g)(x)
- quotient (f ÷ g)(x)
- composition (f o g)(x)= f(g(x))
|
 not
not 


 odd function
f(-x) = -f(x)
 even function
f(-x) = f(x)

![[MC,i. Home]](http://www.mathnstuff.com/gif/mcihome.gif) Last page
Next page
asquared@mathnstuff.com
Last page
Next page
asquared@mathnstuff.com