- Hi,
- Today you will:
- Compute the 5 statistics needed to create a box plot.

- Have the TI create the boxplot once you've adjusted the window.

1-2. Compute Statistics and Create A Boxplot
A boxplot is a picture of data that depicts each of the following
- lowest data point
- Q1, the first quartile or 25th percentile, or the MEDIAN OF THE LOWER HALF OF THE DATA.
- Q2, the second quartile or 50th percentile, or the MEDIAN OF THE DATA.
- Q3, the third quartile or 75th percentile, or the MEDIAN OF THE UPPER HALF OF THE DATA.
- highest data point
It presents a picture of the range of data as well as the manner in which is might be skewed.
 |
It also depicts the INNER QUARTILE RANGE, the range of the middle 50% of the data, Q3 - Q1.
The inner quartile range is used to analyse if any data is extreme, or an outlier, or might be questioned as to the validity of that data point.
 |
You began work on this last class when you used the calculator to compute statistical data.
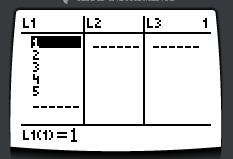 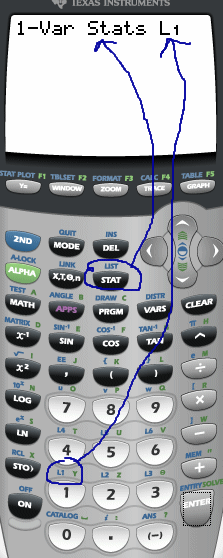 |
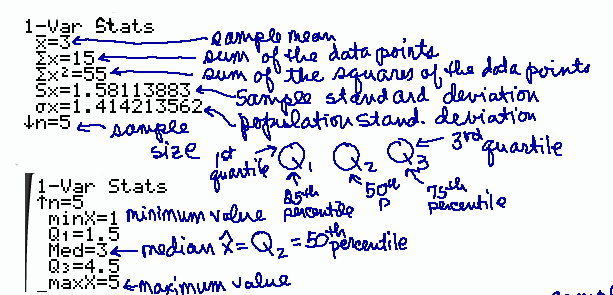 In class you did not complete the boxplot but did learn to adjust the viewing window to do that. 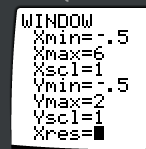
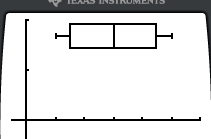 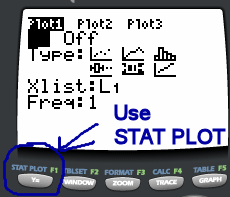
You are required to know how to do this for the test and for Project I, to be completed as homework after the test. |


![[MC,i. Home Page]](http://www.mathnstuff.com/math/spoken/here/1gif/mcihome.gif)
![[Good Stuff Page]](http://www.mathnstuff.com/gif/goods.gif)
![[Semester Schedule]](http://www.mathnstuff.com/gif/semestr.gif)
![[MSH! Home]](http://www.mathnstuff.com/math/spoken/here/1gif/mshhome.gif)
![[MSH! Grouped Words]](http://www.mathnstuff.com/math/spoken/here/1gif/apply.gif)
![[MSH! Classes]](http://www.mathnstuff.com/math/spoken/here/1gif/class.gif)
![[Dictionary Words]](http://www.mathnstuff.com/math/spoken/here/1gif/words.gif)