[tutorials & resource material arranged by topic Class Table [next] [last]

MIDDLE GROUND - A Statistic is a Description


The Meaning of A Statistic
 
      A statistic is a one-number description of a set of data, or numbers used as measurements or counts - lenghts of arms, number of days, number of fish in a catch - or, rarely, a number in that set.
      Mathematicians use the statistic to describe data much as you might use one word to describe a situation or thing or person. It's not a perfect summary, but it is all that might be needed.
 
 
The Statistic Meaning Center
 
      Number, n, is the statistic describing how big the set of numbers is, how many pieces of data are in the set.
      Average is the statistic which describes the center of a set of data, a set of numbers which are measurements or counts.
      The most commonly used averages are the mean (arithmetic average), mode (most frequent number), median (middle number when numbers are listed smallest to largest).
      [Please visit each link in the above paragraph to see how each statistic is computed.]
      Each average, you see, has a different meaning -- describes a different center.
      The mean, for example, is the average computed by adding each piece of data, each number in the set, then dividing the total by n, the number of numbers.   See mean.
      For a sample of numbers, add the numbers, divide by the number of numbers, n.
     
      For the entire set (a population) of numbers, add the numbers, divide by the number of numbers, n.
 
 
The Statistics Measuring Spread
 
      Range and standard deviation are statistics which measure spread - how the data is distributed.
      To compute the range, subtract the smallest number from the largest number to find the difference between the largest and smallest numbers.
      To compute the standard deviation, average the difference between each piece of data and the mean and do it in the standard way.
 
      For a sample of data, do it in this standard way:
  • compute the difference between each piece of data and the mean,
  • square each difference (to remove the sign),
  • add the differences,
  • divide by n - 1 (to get a variance, a kind of spread),
  • take the square root to sort of undo the squaring.
 
      For a population of data, do it in this standard way:
  • compute the difference between each piece of data and the mean,
  • square each difference (to remove the sign),
  • add the differences,
  • divide by n (to get a variance, a kind of spread),
  • take the square root to sort of undo the squaring.
 
 
Use both Mean and Standard Deviation
to Create A Number Line
 
      A number line has an origin or center and unit of measure or scale.
 
      A statististical number line has as its origin the mean, 
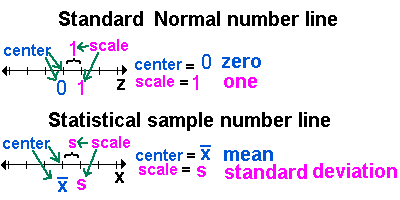
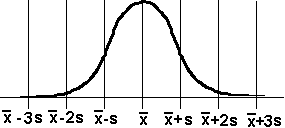
, and has the standard deviation, s, as its scale or unit of spread.
 
      The entire number line may be written in terms of the mean and the standard deviation, and s.


A Normal Frequency Distribution
 
      Frequency distributions are all shapes, but a statistically normal frequency distribution has the mean as its mean, its mode, and its median and it looks like a symmetric mound or bell.
 
      The word normal is a very powerful adjective when used to describe a frequency distribution or when used to describe the data of a sample or population.
 
      Continue to the next page to learn more about a normal distribution.
[next] [last]
[MC,i. Home] [Table] [Words] Classes [this semester's schedule w/links] [Good Stuff -- free & valuable resources] [next] [last]
© 2005, Agnes Azzolino
www.mathnstuff.com/math/spoken/here/2class/90/stat.htm