[tutorials & resource material arranged by topic Class Table

Statistics I Lab 2, Fall 2012 -- "Spreads and Positions in Ordered Data"


Objectives
This page does two things:
reviews the descriptive statistics from the last lab and box plots,
introduces the the normal distribution and its vocabulary.
 
Answers are at the bottom of the page.


Box Plots
    Box plots and their parameters are generally used if data is not known to be normal and they assist in displaying how the data is distributed.
    The most basic parameters for a box-plot are:
xlow, xmin, lowest score,
1st quartile (Q1, 25th percentile, median of the lower 50% of all data),
2nd quartile (Q2, median, 50th percentile),
3rd quartile (Q3, 75th percentile, median of the upper 50% of all data),
xhigh, xmax, highest score,
inner quartile range, IQR, Q3 - Q1.
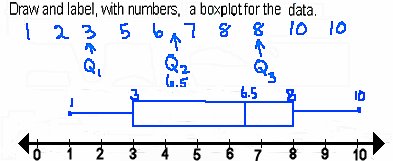
    Box plots are usually drawn to scale so the relationship between the data points is visible. Draw the number line first, then, create the box plot.
    Here's an example.
    As with any boxplot, the middle 50% of all the data points fall in the inner quartile range, Q3 - Q1. In this case the IQR is 8-3, or 5.


Box Plot 1
    Compute the parametric statistics, draw and label the accurate box plot.
14, 49, 42, 29, 21, 21, 34
   
xlow = ______
1st quartile = ______
2nd quartile = ______
3rd quartile = ______
xhigh = ______
inner quartile range, IQR = ______
   
   
answer


Box Plot with a Graphing Calculator
    A graphing calculator will compute all the parameters needed to create a box plot and even draw the box plot for you. Illustrations and instructions follow.


Calculator-Drawn Box Plot
    A midget basketball team held a foul shooting contest with the following results.
    Use a calculator to compute sample statistics and draw a box plot.
    Write a short report.
2, 3, 12, 12, 13, 15, 16, 19, 21, 24, 24, 26, 31   answer


Box and Whisker W/ Outliers
    Often data is not centered very well and has many data points not in the inner quartile range. Depending on the degree of spread, the data points are classified as mild outliers or extreme outliers. These terms are just used to note their position.
    This page does not provide work on this topic.


Bell Shaped and Normal Distributions
    When the data from the calculator problem, is presented as a histograms (in connected bars) as is shown on the left. it is clear it does not look the same as, as symmetric as, or as centered as, the binomial histogram shown in the center, or the normal distribution shown on the right.
    The first two distributions are discrete. The first is the set of foul shot scores [ parameters given below], the second is a binomial distribution [n=4, p=.5]. The last is a normal distribution [ = 0, s = 1] and continuous.
    Also different are the words statisticians usually use to describe the distributions. Each distribution has its own set of parameters used to name the distribution.


Normal Distributions
    The parameters that describe a normal distribution are the mean and standard deviation, be it a sample or a population. The symbols are sample mean, , sample standard deviation, s, population mean, , population standard devaition, .
    The variance, s2 or 2, is also sometimes used.
    Z-scores, z= (x - )/s, are used instead of percentiles becasue the percentiles or probabilities can be very accurately found in tables or by calculator computation using the z-score. Z-scores very accurately express position relative to scale created by the mean and the standard deviation.
    The images below give one an idea of how a normal distribution is shaped or spread out.

    The mean of 0 is used and a standard deviation of 1 is marked on the curve on the right. Notice that 68% of the scores fall in the "middle" of a normal distribution, "within 1 standard deviation of the mean."


Normal Distribution Problems


Box 1 Answer
1. Compute the parametric statistics, draw and label the accurate box plot.
14, 49, 42, 29, 21, 21, 34
   
xlow = 14
1st quartile = 21
2nd quartile = 29
3rd quartile = 42
xhigh = 49
inner quartile range, IQR = 21


Calculator Box Plot Answer
    The 16 scores have the following centers: mean 20.125, modes of 12 and 24, median of 20, midrange of 19. Fifty percent of the scores are found between 12.5 and 28.5. The highest score is 36. The lowest score is 2.


[MC,i. Home] [Good Stuff] Classes [Words]
© 2012 A. Azzolino
www.mathnstuff.com/math/spoken/here/2class/90/fclab2.htm